Analyze Electrooculography (EOG)#
This example can be referenced by citing the package.
This example shows how to use NeuroKit to analyze EOG data.
# Load NeuroKit and other useful packages
import matplotlib.pyplot as plt
import numpy as np

import neurokit2 as nk
Explore the EOG signal#
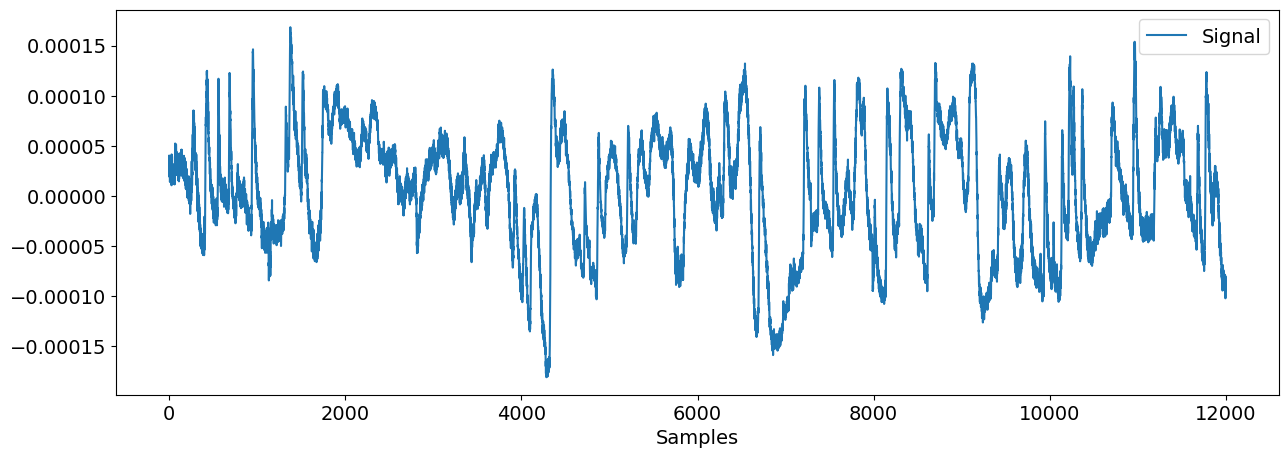
Let’s load the example dataset corresponding to a vertical EOG signal.
eog_signal = nk.data("eog_100hz.csv")

nk.signal_plot(eog_signal)
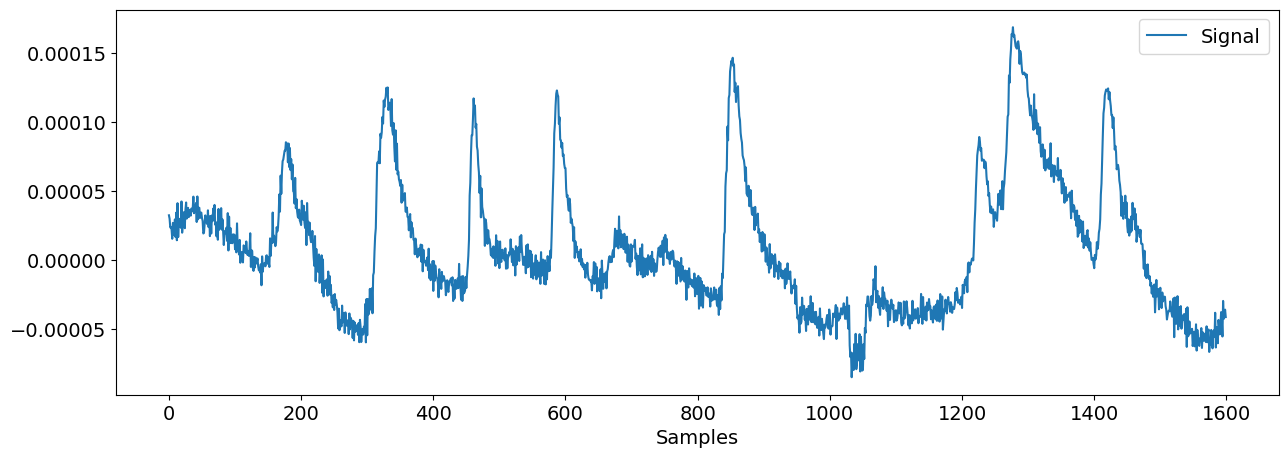
Let’s zoom in to some areas where clear blinks are present.
nk.signal_plot(eog_signal[100:1700])
Clean the signal#
We can now filter the signal to remove some noise and trends.
eog_cleaned = nk.eog_clean(eog_signal, sampling_rate=100, method="neurokit")
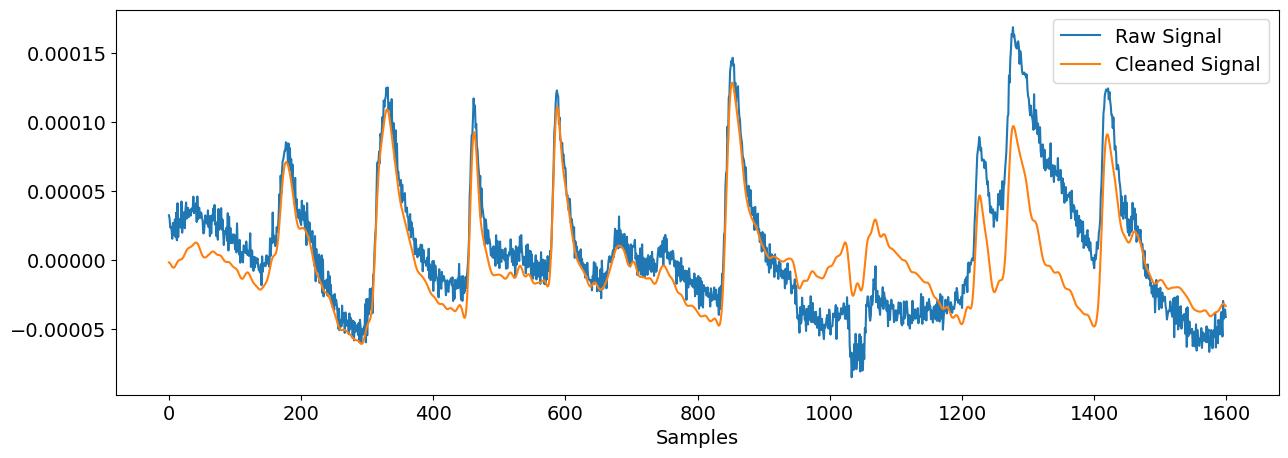
Let’s visualize the same chunk and compare the clean version with the original signal.
nk.signal_plot([eog_signal[100:1700], eog_cleaned[100:1700]], labels=["Raw Signal", "Cleaned Signal"])
Detect and visualize eye blinks#
We will nor run a peak detection algorithm to detect peaks location.
blinks = nk.eog_findpeaks(eog_cleaned, sampling_rate=100, method="mne")
blinks
array([  277,   430,   562,   688,   952,  1378,  1520,  1752,  3353,
        3783,  3928,  4031,  4168,  4350,  4723,  4878,  5213,  5365,
        5699,  5904,  6312,  6539,  6714,  7224,  7382,  7553,  7827,
        8014,  8154,  8312,  8626,  8702,  9140,  9425,  9741,  9948,
       10142, 10230, 10368, 10708, 10965, 11256, 11683, 11775])
events = nk.epochs_create(eog_cleaned, blinks, sampling_rate=100, epochs_start=-0.3, epochs_end=0.7)
data = nk.epochs_to_array(events) # Convert to 2D array
data = nk.standardize(data) # Rescale so that all the blinks are on the same scale
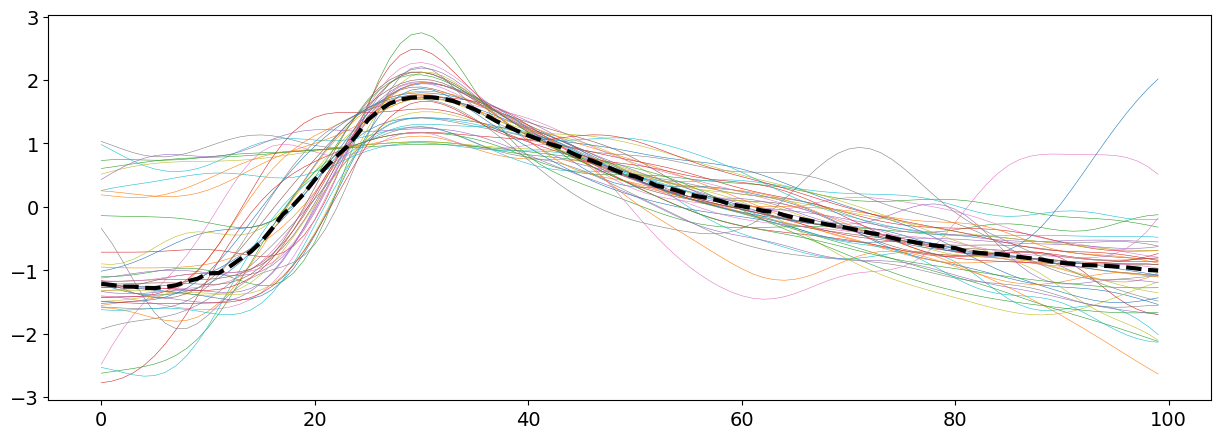
# Plot with their median (used here as a robust average)
plt.plot(data, linewidth=0.4)
plt.plot(np.median(data, axis=1), linewidth=3, linestyle="--", color="black")
[<matplotlib.lines.Line2D at 0x7f2d18bae350>]