
Epochs#
Main#
epochs_create()#
- epochs_create(data, events=None, sampling_rate=1000, epochs_start=0, epochs_end='from_events', event_labels=None, event_conditions=None, baseline_correction=False)[source]#
Create Epochs
Create epochs of a signal or a dataframe.
- Parameters:
data (DataFrame) – A DataFrame containing the different signal(s) as different columns. If a vector of values is passed, it will be transformed in a DataFrame with a single ‘Signal’ column.
events (list or ndarray or dict) – Events onset location. If a dict is passed (e.g., from
events_find()), will select only the ‘onset’ list. If an integer is passed, will use this number to create an evenly spaced list of events. If None, will chunk the signal into successive blocks of the set duration.sampling_rate (int) – The sampling frequency of the signal (in Hz, i.e., samples/second).
epochs_start (int, list) – Epochs start relative to events_onsets (in seconds). The start can be negative to start epochs before a given event (to have a baseline for instance). An integer can be specified to have the same start for all epochs. A list of equal length to the events can be specified to have a different start for each epoch.
epochs_end (int, list) – Epochs end relative to events_onsets (in seconds). An integer can be specified to have the same end for all epochs. A list of equal length to the events can be specified to have a different end for each epoch. If
"from_events", events must be a dict (fromevents_find()). Duration from events will be used asepochs_end.event_labels (list) – A list containing unique event identifiers. If
None, will use the event index number.event_conditions (list) – An optional list containing, for each event, for example the trial category, group or experimental conditions.
baseline_correction (bool) – Defaults to False.
- Returns:
dict – A dict containing DataFrames for all epochs.
See also
events_find,events_plot,epochs_to_df,epochs_plotExamples
Example 1: Find events
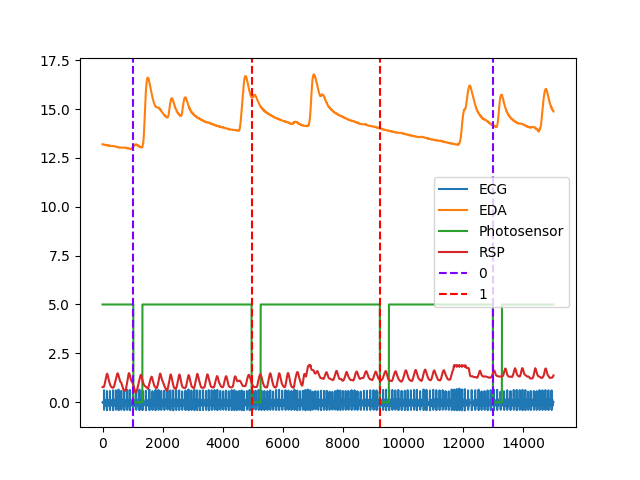
In [1]: import neurokit2 as nk

# Get data
In [2]: data = nk.data("bio_eventrelated_100hz")

# Find events
In [3]: events = nk.events_find(data["Photosensor"],
   ...:                         threshold_keep='below',
   ...:                         event_conditions=["Negative", "Neutral", "Neutral", "Negative"])
   ...:

In [4]: nk.events_plot(events, data)
Out[4]: <Figure size 640x480 with 1 Axes>
Example 2: Create epochs
In [5]: epochs = nk.epochs_create(data, events, sampling_rate=100, epochs_end=3)

In [6]: nk.epochs_plot(epochs)
Example 3: Baseline correction
In [7]: epochs = nk.epochs_create(data, events, sampling_rate=100,
   ...:                           epochs_end=3, baseline_correction=True)
   ...:

In [8]: nk.epochs_plot(epochs)
Example 4: Arbitrary epoching
# Chunk into n blocks of 1 second
In [9]: epochs = nk.epochs_create(data, sampling_rate=100, epochs_end=1)
Example 5: Epochs with list of starting points
In [10]: epochs = nk.epochs_create(data, events, sampling_rate=100,
   ....:                           epochs_start=[0, -1, -1, 0],
   ....:                           epochs_end=[1, 0, 0, 1])
   ....:

In [11]: [len(epochs[i]) for i in epochs.keys()]
Out[11]: [100, 100, 100, 100]
epochs_plot()#
- epochs_plot(epochs, legend=True, columns='all', **kwargs)[source]#
Epochs visualization
Plot epochs.
- Parameters:
epochs (dict) – A dict containing one DataFrame per event/trial. Usually obtained via epochs_create().
legend (bool) – Display the legend (the key of each epoch).
columns (str or list) – Which columns to plot. If ‘all’, plot all columns. If a list, plot only the columns in the list.
**kwargs – Other arguments to pass (not used for now).
See also
events_find,events_plot,epochs_create,epochs_to_dfExamples
Example with data
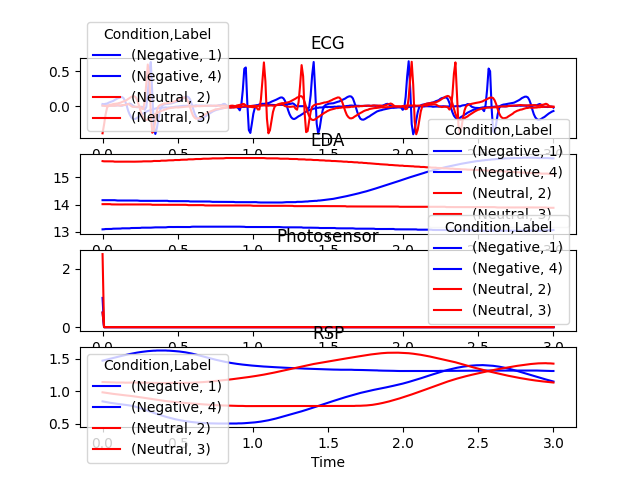
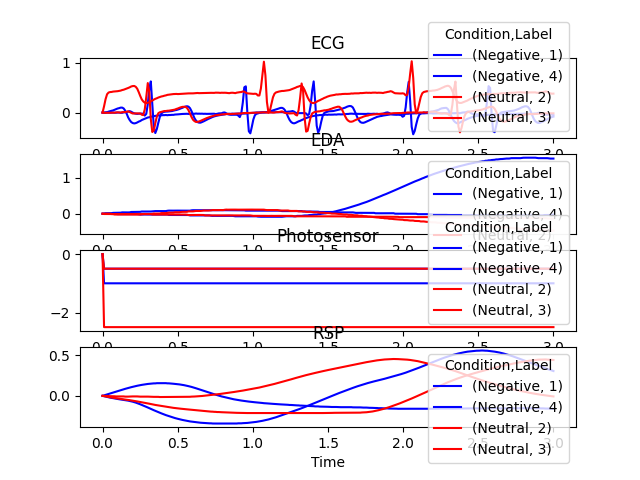
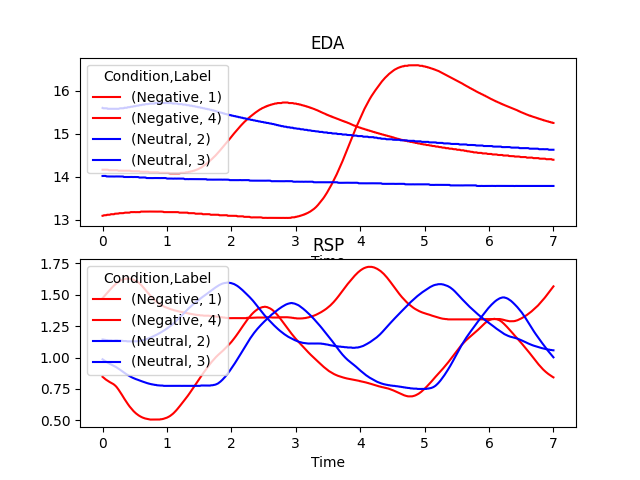
In [1]: import neurokit2 as nk

In [2]: data = nk.data("bio_eventrelated_100hz")

In [3]: events = nk.events_find(data["Photosensor"],
   ...:                         threshold_keep='below',
   ...:                         event_conditions=["Negative", "Neutral", "Neutral", "Negative"])
   ...:

In [4]: epochs = nk.epochs_create(data, events, sampling_rate=100, epochs_end=7)

In [5]: nk.epochs_plot(epochs, columns=["EDA", "RSP"])
Example with ECG Peaks
In [6]: signal = nk.ecg_simulate(duration=10)

In [7]: events = nk.ecg_findpeaks(signal)

In [8]: epochs = nk.epochs_create(signal, events=events["ECG_R_Peaks"], epochs_start=-0.5,
   ...: epochs_end=0.5)
   ...:

In [9]: nk.epochs_plot(epochs)

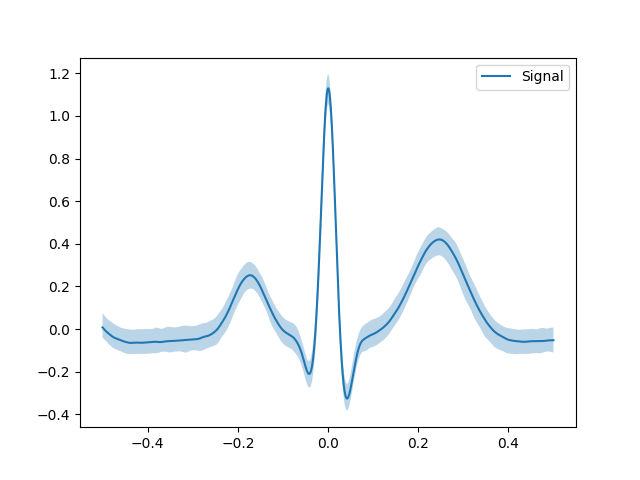
epochs_average()#
- epochs_average(epochs, which=None, indices=['mean', 'std', 'ci'], show=False, **kwargs)[source]#
Compute Grand Average
Average epochs and returns the grand average, as well as the SD and the confidence interval.
- Parameters:
epochs (dict) – A dict containing one DataFrame per event/trial. Usually obtained via epochs_create().
which (str or list) – The name of the column(s) to compute the average from.
**kwargs – Other arguments to pass (not used for now).
See also
events_find,events_plot,epochs_create,epochs_to_dfExamples
Example with ECG Peaks
In [1]: signal = nk.ecg_simulate(duration=10)

In [2]: events = nk.ecg_findpeaks(signal)

In [3]: epochs = nk.epochs_create(signal, events=events["ECG_R_Peaks"], epochs_start=-0.5,
   ...: epochs_end=0.5)
   ...:

In [4]: grand_av = nk.epochs_average(epochs, which="Signal", show=True)
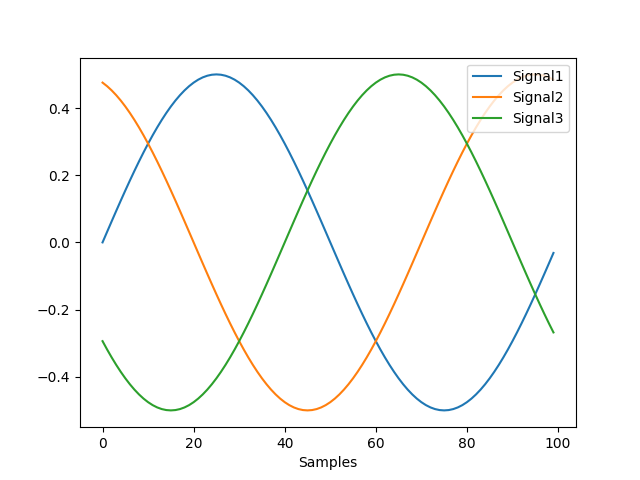
epochs_to_array()#
- epochs_to_array(epochs)[source]#
Epochs to Array
Convert epochs to a numpy array.
Note
TODO: We would like to make it work with uneven epochs (not the same length).
- Parameters:
epochs (dict) – A dict containing one DataFrame per event/trial. Usually obtained via
epochs_create().- Returns:
array – An array containing all signals.
See also
events_find,events_plot,epochs_create,epochs_plotExamples
In [1]: import neurokit2 as nk

# Get data
In [2]: signal = nk.signal_simulate(sampling_rate=100)

# Create epochs
In [3]: epochs = nk.epochs_create(signal, events=[400, 430, 460], sampling_rate=100, epochs_end=1)

# Convert to epochs
In [4]: X = nk.epochs_to_array(epochs)

In [5]: nk.signal_plot(X.T)
epochs_to_df()#
- epochs_to_df(epochs)[source]#
Convert epochs to a DataFrame
Convert epochs to a DataFrame.
- Parameters:
epochs (dict) – A dict containing one DataFrame per event/trial. Usually obtained via epochs_create().
- Returns:
DataFrame – A DataFrame containing all epochs identifiable by the ‘Label’ column, which time axis is stored in the ‘Time’ column.
See also
events_find,events_plot,epochs_create,epochs_plotExamples
In [1]: import neurokit2 as nk

# Get data
In [2]: data = nk.data("bio_eventrelated_100hz")

# Find events
In [3]: events = nk.events_find(data["Photosensor"],
   ...:                         threshold_keep='below',
   ...:                         event_conditions=["Negative", "Neutral", "Neutral", "Negative"])
   ...:

# Create epochs
In [4]: epochs = nk.epochs_create(data, events, sampling_rate=200, epochs_end=3)

# Convert to DataFrame
In [5]: data = nk.epochs_to_df(epochs)

In [6]: data.head()
Out[6]:
        ECG        EDA  Photosensor       RSP  Index Label Condition      Time
0  0.029831  13.087004          1.0  0.847290   1024     1  Negative  0.000000
1  0.027267  13.089751          0.0  0.842743   1025     1  Negative  0.005008
2  0.033203  13.098601          0.0  0.837677   1026     1  Negative  0.010017
3  0.036911  13.098754          0.0  0.833618   1027     1  Negative  0.015025
4  0.048630  13.098296          0.0  0.829742   1028     1  Negative  0.020033