
Misc#
check_type()#
- check_type(x, what='str')[source]#
Check type of input
Creates a list of boolean values to check if the input is of the target type.
- Parameters:
x (int, list, pd.DataFrame, pd.Series, np.ndarray) – Target of checking
what (str) – Compare the dtype of target with what.
- Returns:
array – An array of boolean values.
Examples
In [1]: import neurokit2 as nk

In [2]: nk.check_type([1, 2, 3, "hello"], what="str")
Out[2]: array([False, False, False,  True])

In [3]: nk.check_type(pd.DataFrame({"A": [3, 1, 2, 4, 6, np.nan],
   ...:                             "B": [3, 1, 2, "hello", 6, 5]}), what="str")
   ...:
Out[3]: array([False,  True])
expspace()#
- expspace(start, stop, num=50, out=<class 'int'>, base=1)[source]#
Exponential range
Creates a list of integer values (by default) of a given length from start to stop, spread by an exponential function.
- Parameters:
start (int) – Minimum range values.
stop (int) – Maximum range values.
num (int) – Number of samples to generate. Default is 50. Must be non-negative.
out (type) – Type of the returned values. Default is int.
base (float) – If 1, will use
np.exp(), if 2 will usenp.exp2().
- Returns:
array – An array of integer values spread by the exponential function.
Examples
In [1]: import neurokit2 as nk

In [2]: nk.expspace(start=4, stop=100, num=10)
Out[2]: array([  4,   6,   9,  13,  18,  26,  36,  51,  71, 100])

In [3]: nk.expspace(start=0, stop=1, num=10, out=float)
Out[3]:
array([0.        , 0.08005974, 0.16652904, 0.25992105, 0.36079   ,
       0.46973449, 0.58740105, 0.71448797, 0.85174942, 1.        ])
find_closest()#
- find_closest(closest_to, list_to_search_in, direction='both', strictly=False, return_index=False)[source]#
Find the closest number in the array from a given number x
- Parameters:
closest_to (float) – The target number(s) to find the closest of.
list_to_search_in (list) – The list of values to look in.
direction (str) –
"both"for smaller or greater,"greater"for only greater numbers and"smaller"for the closest smaller.strictly (bool) –
Falsefor strictly superior or inferior orTruefor including equal.return_index (bool) – If
True, will return the index of the closest value in the list.
- Returns:
closest (int) – The closest number in the array.
Example
In [1]: import neurokit2 as nk

# Single number
In [2]: x = nk.find_closest(1.8, [3, 5, 6, 1, 2])

In [3]: x
Out[3]: np.int64(2)

In [4]: y = nk.find_closest(1.8, [3, 5, 6, 1, 2], return_index=True)

In [5]: y
Out[5]: 4

# Vectorized version
In [6]: x = nk.find_closest([1.8, 3.6], [3, 5, 6, 1, 2])

In [7]: x
Out[7]: array([2, 3])
find_consecutive()#
- find_consecutive(x)[source]#
Find and group consecutive values in a list
- Parameters:
x (list) – The list to look in.
- Returns:
list – A list of tuples corresponding to groups containing all the consecutive numbers.
Examples
In [1]: import neurokit2 as nk

In [2]: x = [2, 3, 4, 5, 12, 13, 14, 15, 16, 17, 20]

In [3]: nk.find_consecutive(x)
Out[3]: [(2, 3, 4, 5), (12, 13, 14, 15, 16, 17), (20,)]
find_groups()#
- find_groups(x)[source]#
Find and group repeating (identical) values in a list
- Parameters:
x (list) – The list to look in.
- Returns:
list – A list of tuples corresponding to groups containing all the consecutive numbers.
Examples
In [1]: import neurokit2 as nk

In [2]: x = [2, 2, 2, 2, 1, 3, 3, 2, 2, 2, 1]

In [3]: groups = nk.find_groups(x)

In [4]: groups
Out[4]: [[2, 2, 2, 2], [1], [3, 3], [2, 2, 2], [1]]
find_outliers()#
- find_outliers(data, exclude=2, side='both', method='sd', **kwargs)[source]#
Identify outliers (abnormal values)
Extreme values identification using different methods, such as:
sd: Data is
standardized, i.e., centered and scaled, and absolute value beyond a certain SD threshold are considered as outliers.norm: Extreme values identified using theoretical percentiles to identify outliers beyond a certain theoretical percentile (assuming the data comes from a normal distribution). For example, with this method,
exclude=0.025(one-sided) corresponds to the 2.5% lower bound of the normal distribution, which corresponds to approx. -1.96 SD. This method is related to the SD one, but instead of specifying the threshold in SDs, it is specified in percentiles.percentile: Extreme values identified using percentiles.
- Parameters:
data (list or ndarray) – Data array
exclude (int, float) – Amount of outliers to detect (depends on the chosen method).
side (str) – Can be
"both","left"or"right". Ifexclude=0.05andside="both"andmethod="norm", 2.5% of extreme observation of each side will be marked as outliers.method (str) – Can be “standardize” or “percentile”. The default is “standardize”.
**kwargs (optional) – Other arguments to be passed to
standardize().
- Returns:
outliers (ndarray) – A boolean vector of with
Truebeing the outliers.
See also
Example
In [1]: import neurokit2 as nk

In [2]: data = [-12, 2, 1, 3, 66.6, 2, 1, 3, 2, -42, 2, 4, 1, 12]

# Outliers beyond 2 SD of the mean
In [3]: outliers = nk.find_outliers(data, exclude=2, side="both", method="sd")

In [4]: np.where(outliers)[0]
Out[4]: array([4, 9])

# Outliers beyond 1 MAD of the Median on one side
In [5]: outliers = nk.find_outliers(data, exclude=1, side="left", method="sd", robust=True)

In [6]: np.where(outliers)[0]
Out[6]: array([0, 9])

# 2.5% theoretical percentiles on each side
In [7]: outliers = nk.find_outliers(data, exclude=0.05, method="norm")

In [8]: np.where(outliers)[0]
Out[8]: array([4, 9])

# Outliers are beyond interquartile range
In [9]: outliers = nk.find_outliers(data, exclude=(0.25, 0.75), method="percentile")

In [10]: np.where(outliers)[0]
Out[10]: array([ 0,  4,  9, 11, 13])

# Outliers are beyond interdecile range
In [11]: outliers = nk.find_outliers(data, exclude=(0.1, 0.9), method="percentile")

In [12]: np.where(outliers)[0]
Out[12]: array([ 0,  4,  9, 13])
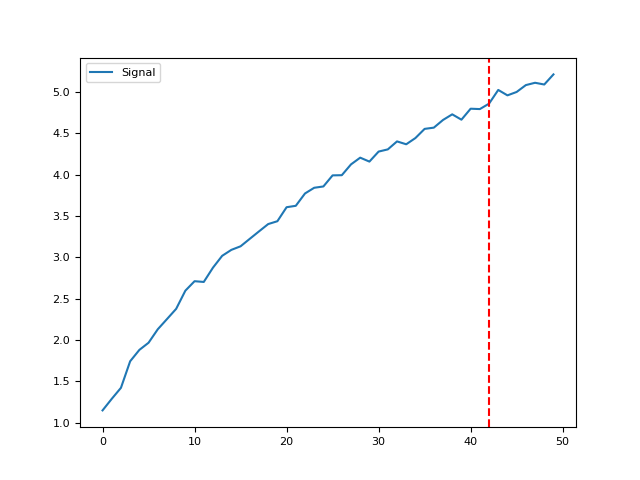
find_plateau()#
- find_plateau(values, show=True)[source]#
Find the point of plateau in an array of values
- Parameters:
values (ndarray) – An array of values.
show (bool) – If
True, will return the plot visualizing the trajectory and point of plateau.
- Returns:
plateau (int) – The index of the plateau.
Example
In [1]: import neurokit2 as nk

# Generate values manually
In [2]: x = np.linspace(1, 5, 50)

In [3]: y = 2.5 * np.log(1.3 * x) + 0.5

In [4]: y = y + 0.05 * np.random.normal(size=len(x))

# Find plateau
In [5]: plateau = nk.find_plateau(y, show=True)

In [6]: plateau
Out[6]: np.int64(13)
find_knee()#
- find_knee(y, x=None, S=1, show=False, verbose=True)[source]#
Find Knee / Elbow
Find the knee / elbow in a curve using a basic adaptation of the kneedle algorithm.
- Parameters:
x (list) – A vector of values for which to detect the knee / elbow.
S (float) – The sensitivity parameter allows us to adjust how aggressive we want to be when detecting knees. Smaller values detect knees quicker, while larger values are more conservative.
Examples
In [1]: import neurokit2 as nk

In [2]: y = np.log(np.arange(1, 100))

In [3]: y += np.random.normal(0, 0.2, len(y))

In [4]: nk.find_knee(y, show=True)
Out[4]: np.int64(24)
References
Satopaa, V., Albrecht, J., Irwin, D., & Raghavan, B. (2011, June). Finding a” kneedle” in a haystack: Detecting knee points in system behavior. In 2011 31st international conference on distributed computing systems workshops (pp. 166-171). IEEE.
listify()#
parallel_run()#
- parallel_run(function, arguments_list, n_jobs=-2, **kwargs)[source]#
Parallel processing utility function (requires the
`joblibpackage)- Parameters:
function (function) – A callable function.
arguments_list (list) – A list of dictionaries. The function will iterate through this list and pass each dictionary inside as
**kwargsto the main function.n_jobs (int) – Number of cores to use.
-2means all but 1. Seejoblib.Parallel().**kwargs – Other arguments that can be passed to
joblib.Parallel(), such asverbose.
- Returns:
list – A list of outputs.
Examples
In [1]: import neurokit2 as nk

In [2]: import time

# The function simply returns the input (but waits 3 seconds.)
In [3]: def my_function(x):
   ...:      time.sleep(3)
   ...:      return x
   ...:

In [4]: arguments_list = [{"x": 1}, {"x": 2}, {"x": 3}]

In [5]: nk.parallel_run(my_function, arguments_list)
progress_bar()#
- progress_bar(it, prefix='', size=40, verbose=True)[source]#
Progress Bar
Display a progress bar.
- Parameters:
it (iterable) – An iterable object.
prefix (str) – A prefix to display before the progress bar.
size (int) – The size of the progress bar.
verbose (bool) – Whether to display the progress bar.
Examples
In [1]: import neurokit2 as nk

In [2]: for i, j in nk.progress_bar(["a", "b", "c"], prefix="Progress: "):
   ...:     pass
   ...:
Progress: [........................................] 0/3
Progress: [█████████████...........................] 1/3
Progress: [██████████████████████████..............] 2/3
Progress: [████████████████████████████████████████] 3/3


In [3]: print(i, j)
2 c
replace()#
- replace(data, replacement_dict)[source]#
Replace values using a dictionary
- Parameters:
data (array) – The data to replace values.
replacement_dict (dict) – A replacement dictionary of the form
{old_value: new_value}.
- Returns:
array – Array containing the replaced values.
Examples
import neurokit2 as nk
data = [0, 1, 2, 3] replacement = {0: 99, 3: 42} replaced = nk.replace(data, replacement) replaced
as_vector()#
- as_vector(x)[source]#
Convert to vector
Examples
import neurokit2 as nk
x = nk.as_vector(x=range(3)) y = nk.as_vector(x=[0, 1, 2]) z = nk.as_vector(x=np.array([0, 1, 2])) z
x = nk.as_vector(x=0) x
x = nk.as_vector(x=pd.Series([0, 1, 2])) y = nk.as_vector(x=pd.DataFrame([0, 1, 2])) y
Any function appearing below this point is not explicitly part of the documentation and should be added. Please open an issue if there is one.
Submodule for NeuroKit.
isort:skip_file (since isort-ing the imports generates circular imports)
- exception NeuroKitWarning[source]#
Category for runtime warnings that occur within the NeuroKit library.
- check_random_state(seed=None)[source]#
Turn seed into a random number generator
- Parameters:
seed (None, int, numpy.random.RandomState or numpy.random.Generator) – Seed for the random number generator. If seed is None, a numpy.random.Generator is created with fresh, unpredictable entropy. If seed is an int, a new numpy.random.RandomState instance is created, seeded with seed. If seed is already a Generator or RandomState instance then that instance is used. The manin difference between the legacy RandomState class and the new Generator class is that the former has better reproducibililty and compatibililty guarantees (it is effectively frozen from NumPy v1.16) while the latter has better statistical “randomness” properties and lower computational cost. See: https://numpy.org/doc/stable/reference/random/legacy.html for further information. Note: to initialise the new Generator class with an integer seed, use, e.g.:
check_random_state(np.random.SeedSequence(123)).- Returns:
rng (numpy.random.Generator or numpy.random.RandomState) – Random number generator.
- check_random_state_children(random_state_parent, random_state_children, n_children=1)[source]#
Create new independent children random number generators to be used in sub-functions
- Parameters:
random_state_parent (None, int, numpy.random.RandomState or numpy.random.Generator) – Parent’s random state (see
misc.check_random_state).random_state_children ({‘legacy’, ‘spawn’}, None, int, numpy.random.RandomState or numpy.random.Generator) – If
"legacy", use the same random state as the parent (discouraged as it generates dependent random streams). If"spawn", spawn independent children random number generators from the parent random state. If any of the other types, generate independent children random number generators from the random_state_children provided.n_children (int) – Number of children generators to be spawned.
- Returns:
children_generators (list of generators) – List of children random number generators.
- create_report(file='myreport.html', signals=None, info={'sampling_rate': 1000}, fig=None)[source]#
Reports
Create report containing description and figures of processing. This function is meant to be used via the
rsp_process()orppg_process()functions.- Parameters:
file (str) – Name of the file to save the report to. Can also be
"text"to simply print the text in the console.signals (pd.DataFrame) –
- A DataFrame of signals. Usually obtained from
rsp_process(),ppg_process(), or
- A DataFrame of signals. Usually obtained from
info (dict) – A dictionary containing the information of peaks and the signals’ sampling rate. Usually obtained from
rsp_process()orppg_process().fig (matplotlib.figure.Figure or plotly.graph_objects.Figure) – A figure containing the processed signals. Usually obtained from
rsp_plot(),ppg_plot(), oremg_plot().
- Returns:
str – The report as a string.
See also
rsp_process,ppg_process,emg_processExamples
In [1]: import neurokit2 as nk

In [2]: rsp = nk.rsp_simulate(duration=30, sampling_rate=200, random_state=0)

In [3]: signals, info = nk.rsp_process(rsp, sampling_rate=200, report="text")
The raw signal, sampled at 200 Hz, was preprocessed using a second order 0.05-3 Hz bandpass Butterworth filter.

The peak detection was carried out using the method described in Khoadadad et al. (2018).

The respiratory volume per time computation was carried out using the method described in Harrison et al. (2021).

|   RSP_Rate_Mean |   RSP_Rate_SD |
|----------------:|--------------:|
|          14.202 |      0.463635 |

References
- Harrison, S. J., Bianchi, S., Heinzle, J., Stephan, K. E., Iglesias, S., & Kasper, L. (2021).
            A Hilbert-based method for processing respiratory timeseries.
            Neuroimage, 230, 117787.
- Khodadad, D., Nordebo, S., Müller, B., Waldmann, A., Yerworth, R., Becher, T., ... & Bayford, R. (2018).
            Optimized breath detection algorithm in electrical impedance tomography.
            Physiological measurement, 39(9), 094001.
- Makowski, D., Pham, T., Lau, Z. J., Brammer, J. C., Lespinasse, F., Pham, H.,
    Schölzel, C., & Chen, S. A. (2021). NeuroKit2: A Python toolbox for neurophysiological signal processing.
    Behavior Research Methods, 53(4), 1689–1696. https://doi.org/10.3758/s13428-020-01516-y
- fig2img(fig)[source]#
Matplotlib Figure to PIL Image
Convert a Matplotlib figure to a PIL Image
- Parameters:
fig (plt.figure) – Matplotlib figure.
- Returns:
list – The rescaled values.
Examples
In [1]: import neurokit2 as nk

In [2]: import matplotlib.pyplot as plt

In [3]: plt.plot([1, 2, 3, 4, 5])  # Make plot
Out[3]: [<matplotlib.lines.Line2D at 0x7fa8bfdbec10>]

In [4]: fig = plt.gcf()  # Get current figure

In [5]: nk.fig2img(fig)  # Convert to PIL Image
Out[5]: <PIL.PngImagePlugin.PngImageFile image mode=RGBA size=640x480>

In [6]: plt.close(fig)  # Close figure
- spawn_random_state(rng, n_children=1)[source]#
Create new independent children random number generators from parent generator/seed
- Parameters:
rng (None, int, numpy.random.RandomState or numpy.random.Generator) – Random number generator to be spawned (numpy.random.RandomState or numpy.random.Generator). If it is None or an int seed, then a parent random number generator is first created with
misc.check_random_state.n_children (int) – Number of children generators to be spawned.
- Returns:
children_generators (list of generators) – List of children random number generators.
Examples
Example 1: Simulate data for a cohort of participants
In [1]: import neurokit2 as nk

In [2]: master_seed = 42

In [3]: n_participants = 8

In [4]: participants_RNGs = nk.misc.spawn_random_state(master_seed, n_children=n_participants)

In [5]: PPGs = []

In [6]: for i in range(n_participants):
   ...:     PPGs.append(nk.ppg_simulate(random_state=participants_RNGs[i]))
   ...: