
ECG#
Main#
ecg_process()#
- ecg_process(ecg_signal, sampling_rate=1000, method='neurokit', **kwargs)[source]#
Automated pipeline for preprocessing an ECG signal
This function runs different preprocessing steps: Cleaning (using
ecg_clean()), peak detection (usingecg_peaks()), heart rate calculation (usingsignal_rate()), signal quality assessment (usingecg_quality()), QRS complex delineation (usingecg_delineate()), and cardiac phase determination (usingecg_phase()).Help us improve the documentation of this function by making it more tidy and useful!
- Parameters:
ecg_signal (Union[list, np.array, pd.Series]) – The raw single-channel ECG signal.
sampling_rate (int) – The sampling frequency of
ecg_signal(in Hz, i.e., samples/second). Defaults to 1000.method (str) – The processing method used for signal cleaning (using
ecg_clean()) and peak detection (usingecg_peaks()). Defaults to'neurokit'. Available methods are'neurokit','pantompkins1985','hamilton2002','elgendi2010','engzeemod2012'. We aim at improving this aspect to make the available methods more transparent, and be able to generate specific reports. Please get in touch if you are interested in helping out with this.
- Returns:
signals (DataFrame) – A DataFrame of the same length as the
ecg_signalcontaining the following columns:ECG_Raw: The raw signal.ECG_Clean: The cleaned signal.ECG_Rate: Heart rate interpolated between R-peaks.ECG_Quality: The quality of the cleaned signal.ECG_R_Peaks: The R-peaks marked as “1” in a list of zeros.ECG_R_Onsets: The R-onsets marked as “1” in a list of zeros.ECG_R_Offsets: The R-offsets marked as “1” in a list of zeros.ECG_P_Peaks: The P-peaks marked as “1” in a list of zeros.ECG_P_Onsets: The P-onsets marked as “1” in a list of zeros.ECG_P_Offsets: The P-offsets marked as “1” in a list of zeros.ECG_Q_Peaks: The Q-peaks marked as “1” in a list of zeros.ECG_S_Peaks: The S-peaks marked as “1” in a list of zeros.ECG_T_Peaks: The T-peaks marked as “1” in a list of zeros.ECG_T_Onsets: The T-onsets marked as “1” in a list of zeros.ECG_T_Offsets: The T-offsets marked as “1” in a list of zeros.ECG_Phase_Atrial: Cardiac phase (atrial), marked by “1” for systole and “0” for diastole.ECG_Phase_Ventricular: Cardiac phase (ventricular), marked by “1” for systole and “0” for diastole.ECG_Phase_Completion_Atrial: Cardiac phase (atrial) completion, expressed as a fraction (from 0 to 1), representing the stage of the current cardiac phase.ECG_Phase_Completion_Ventricular: Cardiac phase (ventricular) completion, expressed as a fraction (from 0 to 1), representing the stage of the current cardiac phase.
rpeaks (dict) – A dictionary containing the samples at which the R-peaks occur, accessible with the key
"ECG_R_Peaks", as well as the signals’ sampling rate.
See also
ecg_clean,ecg_peaks,ecg_quality,ecg_delineate,ecg_phase,ecg_plot,signal_rateExamples
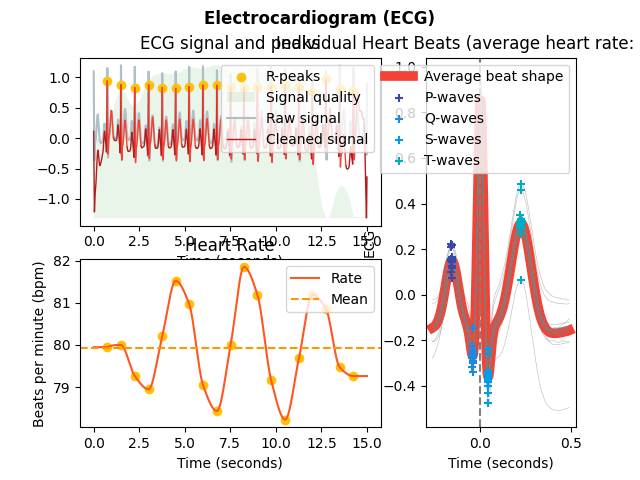
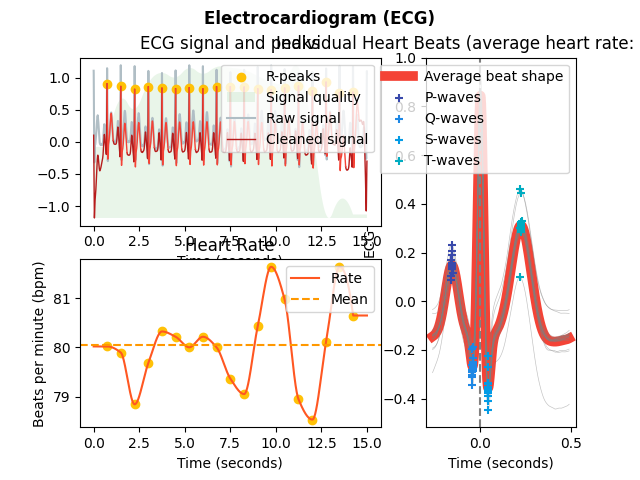
In [1]: import neurokit2 as nk

# Simulate ECG signal
In [2]: ecg = nk.ecg_simulate(duration=15, sampling_rate=1000, heart_rate=80)

# Preprocess ECG signal
In [3]: signals, info = nk.ecg_process(ecg, sampling_rate=1000)

# Visualize
In [4]: nk.ecg_plot(signals, info)
ecg_analyze()#
- ecg_analyze(data, sampling_rate=1000, method='auto')[source]#
Automated Analysis ECG
Performs ECG analysis by computing relevant features and indices on either epochs (event-related analysis) or on longer periods of data (interval-related analysis), such as resting-state data.
- Parameters:
data (Union[dict, pd.DataFrame]) – A dictionary of epochs, containing one DataFrame per epoch, usually obtained via
epochs_create(), or a DataFrame containing all epochs, usually obtained viaepochs_to_df(). Can also take a DataFrame of processed signals from a longer period of data, typically generated byecg_process()orbio_process(). Can also take a dict containing sets of separate periods of data.sampling_rate (int) – The sampling frequency of the signal (in Hz, i.e., samples/second). Defaults to 1000Hz.
method (str) – Can be one of
"event-related"for event-related analysis on epochs, or"interval-related"for analysis on longer periods of data. Defaults toauto, where the method will be chosen based on the mean duration of the data ("event-related"for duration under 10s).
- Returns:
DataFrame – A dataframe containing the analyzed ECG features. If event-related analysis is conducted, each epoch is indicated by the
Labelcolumn. Seeecg_eventrelated()andecg_intervalrelated()docstrings for details.
Examples
Example 1: Event-related analysis
In [1]: import neurokit2 as nk

# Download the data
In [2]: data = nk.data("bio_eventrelated_100hz")

# Process the data for event-related analysis
In [3]: df, info = nk.bio_process(ecg=data["ECG"], sampling_rate=100)

In [4]: events = nk.events_find(data["Photosensor"], threshold_keep='below',
   ...:                         event_conditions=["Negative", "Neutral", "Neutral", "Negative"])
   ...:

In [5]: epochs = nk.epochs_create(df, events, sampling_rate=100, epochs_start=-0.1, epochs_end=1.9)

# Analyze
In [6]: analyze_epochs = nk.ecg_analyze(epochs, sampling_rate=100)

# Get a dataframe with all the results
In [7]: analyze_epochs
Out[7]:
  Label Condition  ...  ECG_Phase_Completion_Ventricular  ECG_Quality_Mean
1     1  Negative  ...                          0.400000          0.952189
2     2   Neutral  ...                          0.553846          0.923616
3     3   Neutral  ...                          0.133333          0.930223
4     4  Negative  ...                          0.575342          0.955769

[4 rows x 18 columns]
Example 2: Interval-related analysis
In [8]: import neurokit2 as nk

# Download the resting-state data
In [9]: data = nk.data("bio_resting_5min_100hz")

# Process the data
In [10]: df, info = nk.ecg_process(data["ECG"], sampling_rate=100)

# Analyze
In [11]: analyze_df = nk.ecg_analyze(df, sampling_rate=100)

# Get results
In [12]: analyze_df
Out[12]:
  ECG_Rate_Mean  ... HRV_Symbolic_EqualProb4_2UV
0     86.392105  ...     [[0.14219114219114218]]

[1 rows x 96 columns]
ecg_simulate()#
- ecg_simulate(duration=10, length=None, sampling_rate=1000, noise=0.01, heart_rate=70, heart_rate_std=1, method='ecgsyn', random_state=None, random_state_distort='spawn', **kwargs)[source]#
Simulate an ECG/EKG signal
Generate an artificial (synthetic) ECG signal of a given duration and sampling rate using either the ECGSYN dynamical model (McSharry et al., 2003) or a simpler model based on Daubechies wavelets to roughly approximate cardiac cycles.
- Parameters:
duration (Union[int, float]) – Desired recording length in seconds.
sampling_rate (int) – The desired sampling rate (in Hz, i.e., samples/second).
length (int) – The desired length of the signal (in samples).
noise (float) – Noise level (amplitude of the laplace noise).
heart_rate (int) – Desired simulated heart rate (in beats per minute). The default is 70. Note that for the
"ECGSYN"method, random fluctuations are to be expected to mimick a real heart rate. These fluctuations can cause some slight discrepancies between the requested heart rate and the empirical heart rate, especially for shorter signals.heart_rate_std (int) – Desired heart rate standard deviation (beats per minute).
method (str) – The model used to generate the signal. Can be
"simple"for a simulation based on Daubechies wavelets that roughly approximates a single cardiac cycle. If"ecgsyn"(default), will use the model desbribed McSharry et al. (2003). If"multileads", will return a DataFrame containing 12-leads (see 12-leads ECG simulation).random_state (None, int, numpy.random.RandomState or numpy.random.Generator) – Seed for the random number generator. See for
misc.check_random_statefor further information.random_state_distort ({‘legacy’, ‘spawn’}, None, int, numpy.random.RandomState or numpy.random.Generator) – Random state to be used to distort the signal. If
"legacy", use the same random state used to generate the signal (discouraged as it creates dependent random streams). If"spawn", spawn independent children random number generators from the random_state argument. If any of the other types, generate independent children random number generators from the random_state_distort provided (this allows generating multiple version of the same signal distorted by different random noise realizations).**kwargs – Other keywords parameters for ECGSYN algorithm, such as
"lfhfratio","ti","ai","bi".
- Returns:
array – Vector containing the ECG signal.
Examples
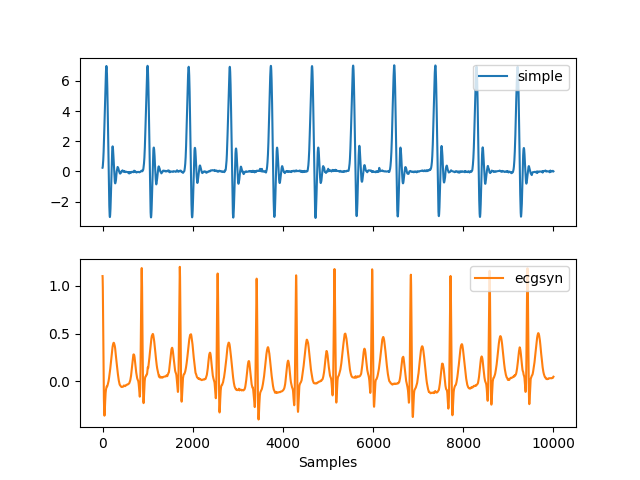
Example 1: Simulate single lead ECG
In [1]: import neurokit2 as nk

In [2]: ecg1 = nk.ecg_simulate(duration=10, method="simple")

In [3]: ecg2 = nk.ecg_simulate(duration=10, method="ecgsyn")

# Visualize result
In [4]: nk.signal_plot([ecg1, ecg2], labels=["simple", "ecgsyn"], subplots=True)
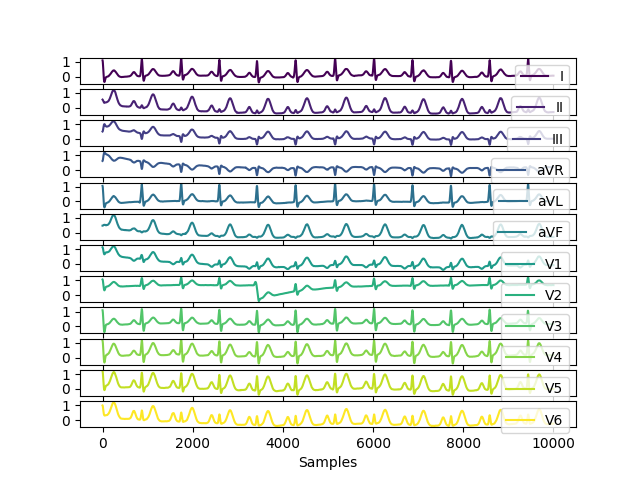
Example 2: Simulate 12-leads ECG
In [5]: ecg12 = nk.ecg_simulate(duration=10, method="multileads")

# Visualize result
In [6]: nk.signal_plot(ecg12, subplots=True)
See also
References
McSharry, P. E., Clifford, G. D., Tarassenko, L., & Smith, L. A. (2003). A dynamical model for generating synthetic electrocardiogram signals. IEEE transactions on biomedical engineering, 50 (3), 289-294.
ecg_plot()#
- ecg_plot(ecg_signals, info=None)[source]#
Visualize ECG data
Plot ECG signals and R-peaks.
- Parameters:
ecg_signals (DataFrame) – DataFrame obtained from
ecg_process().info (dict) – The information Dict returned by
ecg_process(). Defaults toNone.
See also
- Returns:
Though the function returns nothing, the figure can be retrieved and saved as follows
.. code-block:: python – # To be run after ecg_plot() fig = plt.gcf() fig.set_size_inches(10, 12, forward=True) fig.savefig(“myfig.png”)
Examples
In [1]: import neurokit2 as nk

# Simulate data
In [2]: ecg = nk.ecg_simulate(duration=15, sampling_rate=1000, heart_rate=80)

# Process signal
In [3]: signals, info = nk.ecg_process(ecg, sampling_rate=1000)

# Plot
In [4]: nk.ecg_plot(signals, info)
Preprocessing#
ecg_clean()#
- ecg_clean(ecg_signal, sampling_rate=1000, method='neurokit', **kwargs)[source]#
ECG Signal Cleaning
Clean an ECG signal to remove noise and improve peak-detection accuracy. Different cleaning methods are implemented.
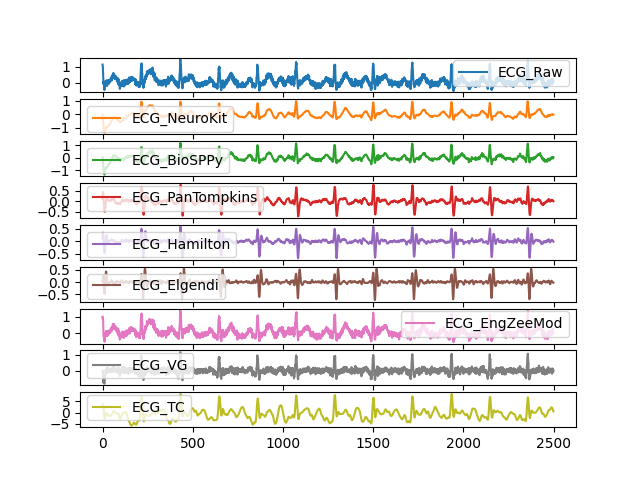
'neurokit'(default): 0.5 Hz high-pass butterworth filter (order = 5), followed by powerline filtering (seesignal_filter()). By default,powerline = 50.'biosppy': Method used in the BioSPPy package. A FIR filter ([0.67, 45] Hz; order = 1.5 * SR). The 0.67 Hz cutoff value was selected based on the fact that there are no morphological features below the heartrate (assuming a minimum heart rate of 40 bpm).'pantompkins1985': Method used in Pan & Tompkins (1985): band-pass filter between 5 and 15 Hz using a Butterworth filter (with zi provided - initial zero-input response provided to avoid transient artifact at beginning).'hamilton2002': Method used in Hamilton (2002): band-pass filter between 8 and 16 Hz using a Butterworth filter (with zi provided).'elgendi2010': Method used in Elgendi et al. (2010): band-pass filter between 8 and 20 Hz using a Butterworth filter (with zi provided).'engzeemod2012': Method used in Engelse & Zeelenberg (1979). Please help providing a better description!'vg': Method used in Visibility Graph Based Detection Emrich et al. (2023) and Koka et al. (2022). A 4.0 Hz high-pass butterworth filter (order = 2).
- Parameters:
ecg_signal (Union[list, np.array, pd.Series]) – The raw ECG channel.
sampling_rate (int) – The sampling frequency of
ecg_signal(in Hz, i.e., samples/second). Defaults to 1000.method (str) – The processing pipeline to apply. Can be one of
"neurokit"(default),"biosppy","pantompkins1985","hamilton2002","elgendi2010","engzeemod2012",'vg'.**kwargs – Other arguments to be passed to specific methods.
- Returns:
array – Vector containing the cleaned ECG signal.
See also
ecg_peaks,ecg_process,ecg_plot,signal_rate,signal_filterExamples
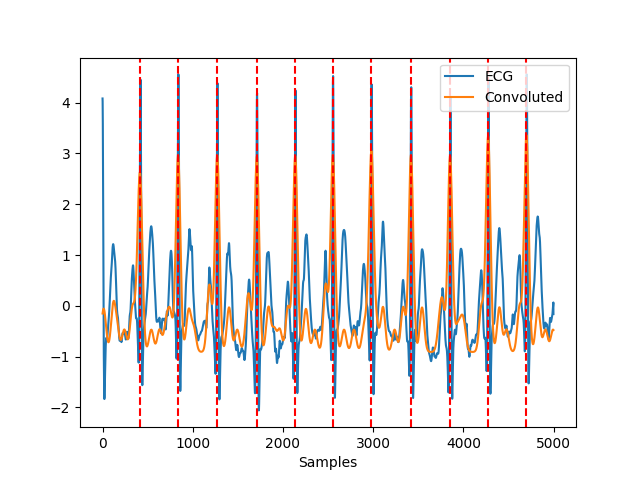
In [1]: import pandas as pd

In [2]: import numpy as np

In [3]: import neurokit2 as nk

In [4]: ecg = nk.ecg_simulate(duration=10, sampling_rate=250, noise=0.2)

In [5]: ecg += np.random.normal(0, 0.1, len(ecg))  # Add Gaussian noise

In [6]: signals = pd.DataFrame({
   ...:     "ECG_Raw" : ecg,
   ...:     "ECG_NeuroKit" : nk.ecg_clean(ecg, sampling_rate=250, method="neurokit"),
   ...:     "ECG_BioSPPy" : nk.ecg_clean(ecg, sampling_rate=250, method="biosppy"),
   ...:     "ECG_PanTompkins" : nk.ecg_clean(ecg, sampling_rate=250, method="pantompkins1985"),
   ...:     "ECG_Hamilton" : nk.ecg_clean(ecg, sampling_rate=250, method="hamilton2002"),
   ...:     "ECG_Elgendi" : nk.ecg_clean(ecg, sampling_rate=250, method="elgendi2010"),
   ...:     "ECG_EngZeeMod" : nk.ecg_clean(ecg, sampling_rate=250, method="engzeemod2012"),
   ...:     "ECG_VG" : nk.ecg_clean(ecg, sampling_rate=250, method="vg"),
   ...:     "ECG_TC" : nk.ecg_clean(ecg, sampling_rate=250, method="templateconvolution")
   ...: })
   ...:

In [7]: signals.plot(subplots=True)
Out[7]:
array([<Axes: >, <Axes: >, <Axes: >, <Axes: >, <Axes: >, <Axes: >,
       <Axes: >, <Axes: >, <Axes: >], dtype=object)
References
Engelse, W. A., & Zeelenberg, C. (1979). A single scan algorithm for QRS-detection and feature extraction. Computers in cardiology, 6(1979), 37-42.
Pan, J., & Tompkins, W. J. (1985). A real-time QRS detection algorithm. IEEE transactions on biomedical engineering, (3), 230-236.
Hamilton, P. (2002). Open source ECG analysis. In Computers in cardiology (pp. 101-104). IEEE.
Elgendi, M., Jonkman, M., & De Boer, F. (2010). Frequency Bands Effects on QRS Detection. Biosignals, Proceedings of the Third International Conference on Bio-inspired Systems and Signal Processing, 428-431.
Emrich, J., Koka, T., Wirth, S., & Muma, M. (2023), Accelerated Sample-Accurate R-Peak Detectors Based on Visibility Graphs. 31st European Signal Processing Conference (EUSIPCO), 1090-1094, doi: 10.23919/EUSIPCO58844.2023.10290007
ecg_quality()#
- ecg_quality(ecg_cleaned, rpeaks=None, sampling_rate=1000, method='averageQRS', approach=None)[source]#
ECG Signal Quality Assessment
Assess the quality of the ECG Signal using various methods:
The
"templatematch"method (loosely based on Orphanidou et al., 2015) computes a continuous index of quality of the ECG signal, by calculating the correlation coefficient between each individual beat morphology and an average (template) beat morphology. This index is therefore relative: 1 corresponds to individual beats that are closest to the beat morphology (i.e. correlate exactly with it) and 0 corresponds to there being no correlation with the average beat morphology. For comparison, the"averageQRS"method forces the signal the quality to vary between 0 (lowest) and 1 (highest). Therefore, even in a high quality signal, some beats will have low values (e.g. 0), whereas others will have high values (e.g. 1). In contrast,"templatematch"computes a quality metric determined by the average of the correlations between the template beat morphology and each individual beat’s morphology. Therefore, it is possible that all beats exhibit high values (e.g. >0.95), indicative of consistent beat morphologies across the signal.The
"dissimilarity"method (loosely based on Sabeti et al., 2019) computes a continuous index of quality of the ECG signal, by calculating the level of dissimilarity between each individual beat shape and an average (template) beat shape (after they are normalised). A value of zero indicates no dissimilarity (i.e. equivalent beat shapes), whereas values above or below indicate increasing dissimilarity. The original method used dynamic time-warping to align the beat shapes prior to calculating the level of dissimilarity, whereas this implementation does not currently include this step.The
"averageQRS"method computes a continuous index of quality of the ECG signal, by interpolating the distance of each QRS segment from the average QRS segment present in the * data. This index is therefore relative: 1 corresponds to heartbeats that are the closest to the average sample and 0 corresponds to the most distant heartbeat from that average sample. Note that 1 does not necessarily means “good”: if the majority of samples are bad, then being close to the average will likely mean bad as well. Use this index with care and plot it alongside your ECG signal to see if it makes sense.The
"zhao2018"method (Zhao et al., 2018) extracts several signal quality indexes (SQIs): QRS wave power spectrum distribution pSQI, kurtosis kSQI, and baseline relative power basSQI. An additional R peak detection match qSQI was originally computed in the paper but left out in this algorithm. The indices were originally weighted with a ratio of [0.4, 0.4, 0.1, 0.1] to generate the final classification outcome, but because qSQI was dropped, the weights have been rearranged to [0.6, 0.2, 0.2] for pSQI, kSQI and basSQI respectively.The
"ho2025"method (Ho et al., 2025) assesses ECG quality on a beat-by-beat basis by predicting whether each RR-interval is accurate. To do so, QRS complexes are detected using a primary QRS detector, and each RR-interval is predicted to be accurate only if a secondary QRS detector detects QRS complexes in the same positions (within a tolerance). In this implementation, all signal samples within an RR-interval are rated as high quality (1) if that RR-interval is predicted to be accurate, or low quality (0) if that RR-interval is predicted to be inaccurate. This approach was derived from the previously proposed bSQI approach.
- Parameters:
ecg_cleaned (Union[list, np.array, pd.Series]) – The cleaned ECG signal in the form of a vector of values.
rpeaks (tuple or list) – The list of R-peak samples returned by
ecg_peaks(). If None, peaks is computed from the signal input.sampling_rate (int) – The sampling frequency of the signal (in Hz, i.e., samples/second).
method (str) – The method for computing ECG signal quality, can be
"averageQRS"(default),"zhao2018","templatematch","dissimilarity"or"ho2025".approach (str) – The data fusion approach as documented in Zhao et al. (2018). Can be
"simple"or"fuzzy". The former performs simple heuristic fusion of SQIs and the latter performs fuzzy comprehensive evaluation. IfNone(default), simple heuristic fusion is used.**kwargs – Keyword arguments to be passed to
signal_power()in the computation of basSQI and pSQI.
- Returns:
array or str – Vector containing the quality index ranging from 0 to 1 for
"averageQRS"method, returns string classification (Unacceptable,Barely acceptableorExcellent) of the signal for"zhao2018"method.
See also
ecg_segment,ecg_delineate,signal_quality,ecg_cleanReferences
Zhao, Z., & Zhang, Y. (2018). “SQI quality evaluation mechanism of single-lead ECG signal based on simple heuristic fusion and fuzzy comprehensive evaluation”. Frontiers in Physiology, 9, 727.
Orphanidou, C. et al. (2015). “Signal-quality indices for the electrocardiogram and photoplethysmogram: derivation and applications to wireless monitoring”. IEEE Journal of Biomedical and Health Informatics, 19(3), 832-8.
Sabeti E. et al. (2019). Signal quality measure for pulsatile physiological signals using morphological features: Applications in reliability measure for pulse oximetry. Informatics in Medicine Unlocked, 16, 100222.
Ho, S.Y.S et al. (2025). “Accurate RR-interval extraction from single-lead, telehealth electrocardiogram signals. medRxiv, 2025.03.10.25323655. https://doi.org/10.1101/2025.03.10.25323655
Examples
Example 1: ‘averageQRS’ method
In [1]: import neurokit2 as nk

In [2]: ecg = nk.ecg_simulate(duration=30, sampling_rate=300, noise=0.2)

In [3]: ecg_cleaned = nk.ecg_clean(ecg, sampling_rate=300)

In [4]: quality = nk.ecg_quality(ecg_cleaned, sampling_rate=300)

In [5]: nk.signal_plot([ecg_cleaned, quality], standardize=True)
Example 2: Zhao et al. (2018) method
In [6]: nk.ecg_quality(ecg_cleaned,
   ...:                sampling_rate=300,
   ...:                method="zhao2018",
   ...:                approach="fuzzy")
   ...:
Out[6]: 'Excellent'
Example 3: Orphanidou et al. (2015) method
In [7]: sampling_rate = 100

In [8]: duration = 20

In [9]: ecg = nk.ecg_simulate(
   ...:     duration=duration, sampling_rate=sampling_rate, heart_rate=70, noise=0.5
   ...: )
   ...:

In [10]: ecg_cleaned = nk.ecg_clean(ecg, sampling_rate=sampling_rate)

In [11]: quality = nk.ecg_quality(ecg_cleaned, sampling_rate=sampling_rate, method="templatematch")

In [12]: nk.signal_plot([ecg_cleaned, quality], standardize=True)
ecg_rsp()#
- ecg_rsp(ecg_rate, sampling_rate=1000, method='vangent2019')[source]#
ECG-Derived Respiration (EDR)
Extract ECG-Derived Respiration (EDR), a proxy of a respiratory signal based on heart rate.
Different methods include:
vangent2019: 0.1-0.4 Hz filter.
soni2019: 0-0.5 Hz filter.
charlton2016: 0.066-1 Hz filter.
sarkar2015: 0.1-0.7 Hz filter.
Warning
Help is required to double-check whether the implementation match the papers.
- Parameters:
ecg_rate (array) – The heart rate signal as obtained via
ecg_rate().sampling_rate (int) – The sampling frequency of the signal that contains the R-peaks (in Hz, i.e., samples/second). Defaults to 1000Hz.
method (str) – Can be one of
"vangent2019"(default),"soni2019","charlton2016"or"sarkar2015".
- Returns:
array – A Numpy array containing the ECG-Derived Respiration signal.
Examples
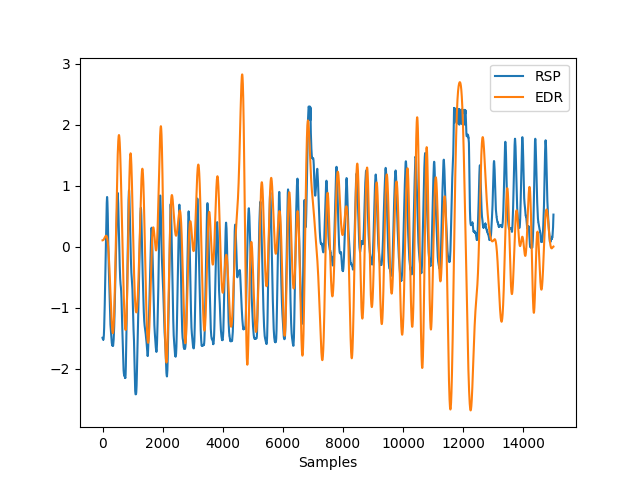
Example 1: Compare to real RSP signal
In [1]: import neurokit2 as nk

# Get heart rate
In [2]: data = nk.data("bio_eventrelated_100hz")

In [3]: rpeaks, info = nk.ecg_peaks(data["ECG"], sampling_rate=100)

In [4]: ecg_rate = nk.signal_rate(rpeaks, sampling_rate=100, desired_length=len(rpeaks))

# Get ECG Derived Respiration (EDR) and add to the data
In [5]: data["EDR"] = nk.ecg_rsp(ecg_rate, sampling_rate=100)

# Visualize result
In [6]: nk.signal_plot([data["RSP"], data["EDR"]], standardize = True)
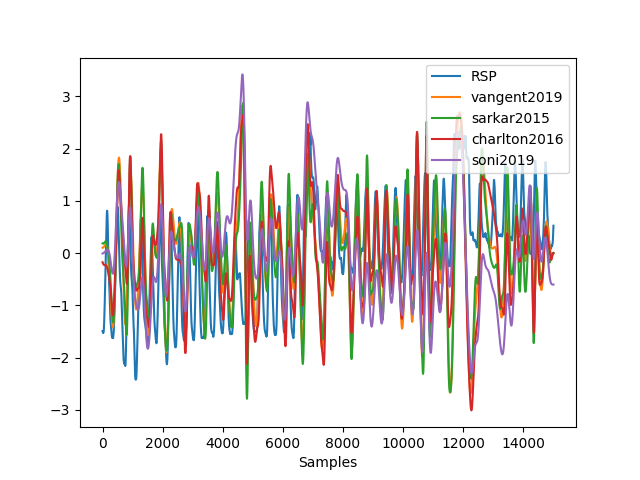
Example 2: Methods comparison
In [7]: data["vangent2019"] = nk.ecg_rsp(ecg_rate, sampling_rate=100, method="vangent2019")

In [8]: data["sarkar2015"] = nk.ecg_rsp(ecg_rate, sampling_rate=100, method="sarkar2015")

In [9]: data["charlton2016"] = nk.ecg_rsp(ecg_rate, sampling_rate=100, method="charlton2016")

In [10]: data["soni2019"] = nk.ecg_rsp(ecg_rate, sampling_rate=100, method="soni2019")

# Visualize results
In [11]: nk.signal_plot([data["RSP"], data["vangent2019"], data["sarkar2015"],
   ....:                 data["charlton2016"], data["soni2019"]], standardize = True)
   ....:
References
van Gent, P., Farah, H., van Nes, N., & van Arem, B. (2019). HeartPy: A novel heart rate algorithm for the analysis of noisy signals. Transportation research part F: traffic psychology and behaviour, 66, 368-378.
Sarkar, S., Bhattacherjee, S., & Pal, S. (2015). Extraction of respiration signal from ECG for respiratory rate estimation.
Charlton, P. H., Bonnici, T., Tarassenko, L., Clifton, D. A., Beale, R., & Watkinson, P. J. (2016). An assessment of algorithms to estimate respiratory rate from the electrocardiogram and photoplethysmogram. Physiological measurement, 37(4), 610.
Soni, R., & Muniyandi, M. (2019). Breath rate variability: a novel measure to study the meditation effects. International Journal of Yoga, 12(1), 45.
ecg_peaks()#
- ecg_peaks(ecg_cleaned, sampling_rate=1000, method='neurokit', correct_artifacts=False, show=False, **kwargs)[source]#
Find R-peaks in an ECG signal
Find R-peaks in an ECG signal using the specified method. You can pass an unfiltered ECG signals as input, but typically a filtered ECG (cleaned using
ecg_clean()) will result in better results.Different algorithms for peak-detection include:
neurokit (default): QRS complexes are detected based on the steepness of the absolute gradient of the ECG signal. Subsequently, R-peaks are detected as local maxima in the QRS complexes. The method is unpublished, but see: (i) neuropsychology/NeuroKit#476 for discussion of this algorithm; and (ii) https://doi.org/10.21105/joss.02621 for the original validation of this algorithm.
pantompkins1985: Algorithm by Pan & Tompkins (1985).
hamilton2002: Algorithm by Hamilton (2002).
zong2003: Algorithm by Zong et al. (2003).
martinez2004: Algorithm by Martinez et al (2004).
christov2004: Algorithm by Christov (2004).
gamboa2008: Algorithm by Gamboa (2008).
elgendi2010: Algorithm by Elgendi et al. (2010).
engzeemod2012: Original algorithm by Engelse & Zeelenberg (1979) modified by Lourenço et al. (2012).
manikandan2012: Algorithm by Manikandan & Soman (2012) based on the Shannon energy envelope (SEE).
khamis2016: UNSW Algorithm by Khamis et al. (2016), designed for both clinical ECGs and poorer quality telehealth ECGs.
kalidas2017: Algorithm by Kalidas et al. (2017).
nabian2018: Algorithm by Nabian et al. (2018) based on the Pan-Tompkins algorithm.
rodrigues2021: Adaptation of the work by Sadhukhan & Mitra (2012) and Gutiérrez-Rivas et al. (2015) by Rodrigues et al. (2021).
emrich2023: FastNVG Algorithm by Emrich et al. (2023) based on the visibility graph detector of Koka et al. (2022). Provides fast and sample-accurate R-peak detection. The algorithm transforms the ecg into a graph representation and extracts exact R-peak positions using graph metrics.
promac: ProMAC combines the result of several R-peak detectors in a probabilistic way. For a given peak detector, the binary signal representing the peak locations is convolved with a Gaussian distribution, resulting in a probabilistic representation of each peak location. This procedure is repeated for all selected methods and the resulting signals are accumulated. Finally, a threshold is used to accept or reject the peak locations. See this discussion for more information on the origins of the method: neuropsychology/NeuroKit#222
Note
Please help us improve the methods’ documentation by adding a small description.
- Parameters:
ecg_cleaned (Union[list, np.array, pd.Series]) – The cleaned ECG channel as returned by
ecg_clean().sampling_rate (int) – The sampling frequency of
ecg_cleaned(in Hz, i.e., samples/second). Defaults to 1000.method (string) – The algorithm to be used for R-peak detection.
correct_artifacts (bool) – Whether or not to identify and fix artifacts, using the method by Lipponen & Tarvainen (2019).
show (bool) – If
True, will show a plot of the signal with peaks. Defaults toFalse.**kwargs – Additional keyword arguments, usually specific for each method.
- Returns:
signals (DataFrame) – A DataFrame of same length as the input signal in which occurrences of R-peaks marked as
1in a list of zeros with the same length asecg_cleaned. Accessible with the keys"ECG_R_Peaks".info (dict) – A dictionary containing additional information, in this case the samples at which R-peaks occur, accessible with the key
"ECG_R_Peaks", as well as the signals’ sampling rate, accessible with the key"sampling_rate".
See also
Examples
Example 1: Find R-peaks using the default method (
"neurokit").
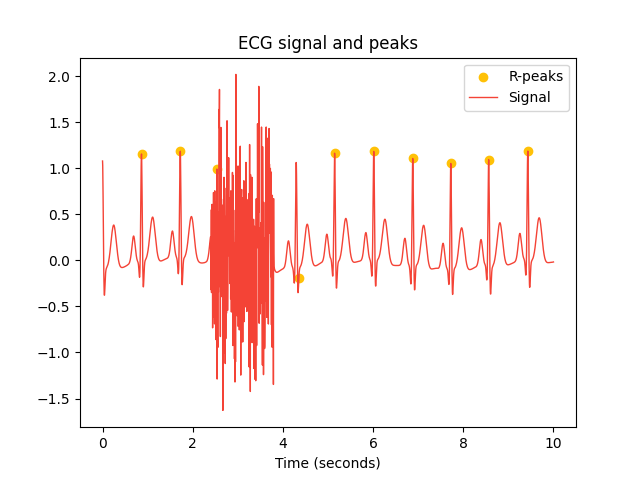
In [1]: import neurokit2 as nk

In [2]: import numpy as np

In [3]: ecg = nk.ecg_simulate(duration=10, sampling_rate=250)

In [4]: ecg[600:950] = ecg[600:950] + np.random.normal(0, 0.6, 350)

In [5]: signals, info = nk.ecg_peaks(ecg, sampling_rate=250, correct_artifacts=True, show=True)
Example 2: Compare different methods
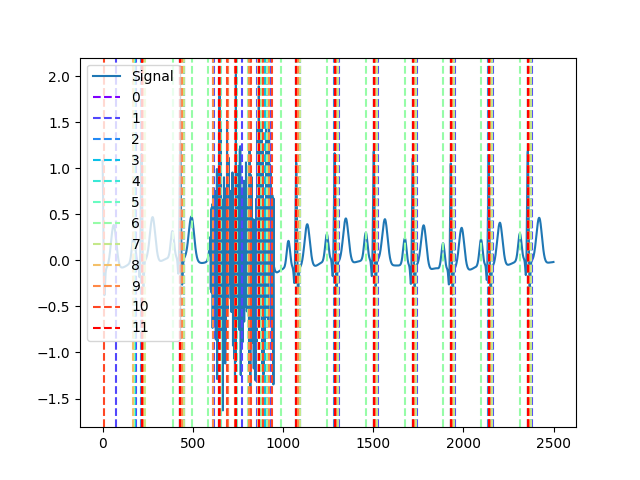
# neurokit (default)
In [6]: cleaned = nk.ecg_clean(ecg, sampling_rate=250, method="neurokit")

In [7]: _, neurokit = nk.ecg_peaks(cleaned, sampling_rate=250, method="neurokit")

# pantompkins1985
In [8]: cleaned = nk.ecg_clean(ecg, sampling_rate=250, method="pantompkins1985")

In [9]: _, pantompkins1985 = nk.ecg_peaks(cleaned, sampling_rate=250, method="pantompkins1985")

# hamilton2002
In [10]: cleaned = nk.ecg_clean(ecg, sampling_rate=250, method="hamilton2002")

In [11]: _, hamilton2002 = nk.ecg_peaks(cleaned, sampling_rate=250, method="hamilton2002")

# zong2003
In [12]: _, zong2003 = nk.ecg_peaks(ecg, sampling_rate=250, method="zong2003")

# martinez2004
In [13]: _, martinez2004 = nk.ecg_peaks(ecg, sampling_rate=250, method="martinez2004")

# christov2004
In [14]: _, christov2004 = nk.ecg_peaks(cleaned, sampling_rate=250, method="christov2004")

# gamboa2008
In [15]: cleaned = nk.ecg_clean(ecg, sampling_rate=250, method="gamboa2008")

In [16]: _, gamboa2008 = nk.ecg_peaks(cleaned, sampling_rate=250, method="gamboa2008")

# elgendi2010
In [17]: cleaned = nk.ecg_clean(ecg, sampling_rate=250, method="elgendi2010")

In [18]: _, elgendi2010 = nk.ecg_peaks(cleaned, sampling_rate=250, method="elgendi2010")

# engzeemod2012
In [19]: cleaned = nk.ecg_clean(ecg, sampling_rate=250, method="engzeemod2012")

In [20]: _, engzeemod2012 = nk.ecg_peaks(cleaned, sampling_rate=250, method="engzeemod2012")

# Manikandan (2012)
In [21]: _, manikandan2012 = nk.ecg_peaks(ecg, sampling_rate=250, method="manikandan2012")

# Khamis (2016)
In [22]: _, khamis2016 = nk.ecg_peaks(ecg, sampling_rate=250, method="khamis2016")

# kalidas2017
In [23]: cleaned = nk.ecg_clean(ecg, sampling_rate=250, method="kalidas2017")

In [24]: _, kalidas2017 = nk.ecg_peaks(cleaned, sampling_rate=250, method="kalidas2017")

# nabian2018
In [25]: _, nabian2018 = nk.ecg_peaks(ecg, sampling_rate=250, method="nabian2018")

# rodrigues2021
In [26]: _, rodrigues2021 = nk.ecg_peaks(ecg, sampling_rate=250, method="rodrigues2021")

# emrich2023
In [27]: cleaned = nk.ecg_clean(ecg, sampling_rate=250, method="emrich2023")

In [28]: _, emrich2023 = nk.ecg_peaks(cleaned, sampling_rate=250, method="emrich2023")

# Collect all R-peak lists by iterating through the result dicts
In [29]: rpeaks = [
   ....:     i["ECG_R_Peaks"]
   ....:     for i in [
   ....:         neurokit,
   ....:         pantompkins1985,
   ....:         nabian2018,
   ....:         hamilton2002,
   ....:         martinez2004,
   ....:         christov2004,
   ....:         gamboa2008,
   ....:         elgendi2010,
   ....:         engzeemod2012,
   ....:         khamis2016,
   ....:         kalidas2017,
   ....:         rodrigues2021,
   ....:         emrich2023
   ....:     ]
   ....: ]
   ....:

# Visualize results
In [30]: nk.events_plot(rpeaks, ecg)
Out[30]: <Figure size 640x480 with 1 Axes>
Example 3: Method-agreement procedure (‘promac’)
In [31]: ecg = nk.ecg_simulate(duration=10, sampling_rate=500)

In [32]: ecg = nk.signal_distort(ecg,
   ....:                         sampling_rate=500,
   ....:                         noise_amplitude=0.05, noise_frequency=[25, 50],
   ....:                         artifacts_amplitude=0.05, artifacts_frequency=50)
   ....:

In [33]: info = nk.ecg_findpeaks(ecg, sampling_rate=250, method="promac", show=True)
References
Pan, J., & Tompkins, W. J. (1985). A real-time QRS detection algorithm. IEEE transactions on biomedical engineering, (3), 230-236.
Hamilton, P. (2002). Open source ECG analysis. In Computers in cardiology (pp. 101-104). IEEE.
Zong, W., Heldt, T., Moody, G. B., & Mark, R. G. (2003). An open-source algorithm to detect onset of arterial blood pressure pulses. In Computers in Cardiology, 2003 (pp. 259-262). IEEE.
Zong, W., Moody, G. B., & Jiang, D. (2003, September). A robust open-source algorithm to detect onset and duration of QRS complexes. In Computers in Cardiology, 2003 (pp. 737-740). IEEE.
Martinez, J. P., Almeida, R., Olmos, S., Rocha, A. P., & Laguna, P. (2004) A wavelet-based ECG delineator: evaluation on standard databases. IEEE Trans Biomed Eng, 51(4), 570–581.
Christov, I. I. (2004). Real time electrocardiogram QRS detection using combined adaptive threshold. Biomedical engineering online, 3(1), 1-9.
Gamboa, H. (2008). Multi-modal behavioral biometrics based on HCI and electrophysiology (Doctoral dissertation, Universidade Técnica de Lisboa).
Elgendi, M., Jonkman, M., & De Boer, F. (2010). Frequency Bands Effects on QRS Detection. Biosignals, Proceedings of the Third International Conference on Bio-inspired Systems and Signal Processing, 428-431.
Engelse, W. A., & Zeelenberg, C. (1979). A single scan algorithm for QRS-detection and feature extraction. Computers in cardiology, 6(1979), 37-42.
Manikandan, M. S., & Soman, K. P. (2012). A novel method for detecting R-peaks in electrocardiogram (ECG) signal. Biomedical Signal Processing and Control, 7(2), 118-128.
Lourenço, A., Silva, H., Leite, P., Lourenço, R., & Fred, A. L. (2012, February). Real Time Electrocardiogram Segmentation for Finger based ECG Biometrics. In Biosignals (pp. 49-54).
Khamis, H., Weiss, R., Xie, Y., Chang, C. W., Lovell, N. H., & Redmond, S. J. (2016). QRS detection algorithm for telehealth electrocardiogram recordings. IEEE Transactions on Biomedical Engineering, 63(7), 1377–1388.
Kalidas, V., & Tamil, L. (2017, October). Real-time QRS detector using stationary wavelet transform for automated ECG analysis. In 2017 IEEE 17th International Conference on Bioinformatics and Bioengineering (BIBE) (pp. 457-461). IEEE.
Nabian, M., Yin, Y., Wormwood, J., Quigley, K. S., Barrett, L. F., Ostadabbas, S. (2018). An Open-Source Feature Extraction Tool for the Analysis of Peripheral Physiological Data. IEEE Journal of Translational Engineering in Health and Medicine, 6, 1-11.
Sadhukhan, D., & Mitra, M. (2012). R-peak detection algorithm for ECG using double difference and RR interval processing. Procedia Technology, 4, 873-877.
Gutiérrez-Rivas, R., García, J. J., Marnane, W. P., & Hernández, A. (2015). Novel real-time low-complexity QRS complex detector based on adaptive thresholding. IEEE Sensors Journal, 15(10), 6036-6043.
Rodrigues, T., Samoutphonh, S., Silva, H., & Fred, A. (2021, January). A Low-Complexity R-peak Detection Algorithm with Adaptive Thresholding for Wearable Devices. In 2020 25th International Conference on Pattern Recognition (ICPR) (pp. 1-8). IEEE.
T. Koka and M. Muma, “Fast and Sample Accurate R-Peak Detection for Noisy ECG Using Visibility Graphs,” 2022 44th Annual International Conference of the IEEE Engineering in Medicine & Biology Society (EMBC), 2022, pp. 121-126.
promacUnpublished. It runs different methods and derives a probability index using convolution. See this discussion for more information on the method: neuropsychology/NeuroKit#222
Lipponen, J. A., & Tarvainen, M. P. (2019). A robust algorithm for heart rate variability time series artefact correction using novel beat classification. Journal of medical engineering & technology, 43(3), 173-181.
Emrich, J., Koka, T., Wirth, S., & Muma, M. (2023), Accelerated Sample-Accurate R-Peak Detectors Based on Visibility Graphs. 31st European Signal Processing Conference (EUSIPCO), 1090-1094, doi: 10.23919/EUSIPCO58844.2023.10290007
ecg_delineate()#
- ecg_delineate(ecg_cleaned, rpeaks=None, sampling_rate=1000, method='dwt', show=False, show_type='peaks', check=False, **kwargs)[source]#
Delineate QRS complex
Function to delineate the QRS complex, i.e., the different waves of the cardiac cycles. A typical ECG heartbeat consists of a P wave, a QRS complex and a T wave. The P wave represents the wave of depolarization that spreads from the SA-node throughout the atria. The QRS complex reflects the rapid depolarization of the right and left ventricles. Since the ventricles are the largest part of the heart, in terms of mass, the QRS complex usually has a much larger amplitude than the P-wave. The T wave represents the ventricular repolarization of the ventricles.On rare occasions, a U wave can be seen following the T wave. The U wave is believed to be related to the last remnants of ventricular repolarization.
- Parameters:
ecg_cleaned (Union[list, np.array, pd.Series]) – The cleaned ECG channel as returned by
ecg_clean().rpeaks (Union[list, np.array, pd.Series]) – The samples at which R-peaks occur. Accessible with the key “ECG_R_Peaks” in the info dictionary returned by
ecg_findpeaks().sampling_rate (int) – The sampling frequency of
ecg_signal(in Hz, i.e., samples/second). Defaults to 1000.method (str) – Can be one of
"peak"for a peak-based method,"prominence"for a peak-prominence-based method (Emrich et al., 2024),"cwt"for continuous wavelet transform or"dwt"(default) for discrete wavelet transform. The"prominence"method might be useful to detect the waves, allowing to set individual physiological limits (see kwargs), while the"dwt"method might be more precise for detecting the onsets and offsets of the waves (but might exhibit lower accuracy when there is significant variation in wave morphology). The"peak"method, which uses the zero-crossings of the signal derivatives, works best with very clean signals.show (bool) – If
True, will return a plot to visualizing the delineated waves information.show_type (str) – The type of delineated waves information showed in the plot. Can be
"peaks","bounds_R","bounds_T","bounds_P"or"all".check (bool) – Defaults to
False. IfTrue, replaces the delineated features withnp.nanif its standardized distance from R-peaks is more than 3.**kwargs – Other optional arguments: If using the
"prominence"method, additional parameters (in milliseconds) can be passed to set individual physiological limits for the search boundaries: -max_qrs_interval: The maximum allowable QRS complex interval. Defaults to 180 ms. -max_pr_interval: The maximum PR interval duration. Defaults to 300 ms. -max_r_rise_time: Maximum duration for the R-wave rise. Defaults to 120 ms. -typical_st_segment: Typical duration of the ST segment. Defaults to 150 ms. -max_p_basepoint_interval: The maximum interval between P-wave on- and offset. Defaults to 100 ms. -max_r_basepoint_interval: The maximum interval between R-wave on- and offset. Defaults to 100 ms. -max_t_basepoint_interval: The maximum interval between T-wave on- and offset. Defaults to 200 ms.
- Returns:
waves (dict) – A dictionary containing additional information. For derivative method, the dictionary contains the samples at which P-peaks, Q-peaks, S-peaks, T-peaks, P-onsets and T-offsets occur, accessible with the keys
"ECG_P_Peaks","ECG_Q_Peaks","ECG_S_Peaks","ECG_T_Peaks","ECG_P_Onsets","ECG_T_Offsets", respectively.For the wavelet and prominence methods, in addition to the above information, the dictionary contains the samples at which QRS-onsets and QRS-offsets occur, accessible with the key
"ECG_P_Peaks","ECG_T_Peaks","ECG_P_Onsets","ECG_P_Offsets","ECG_Q_Peaks","ECG_S_Peaks","ECG_T_Onsets","ECG_T_Offsets","ECG_R_Onsets","ECG_R_Offsets", respectively.signals (DataFrame) – A DataFrame of same length as the input signal in which occurrences of peaks, onsets and offsets marked as “1” in a list of zeros.
See also
ecg_clean,signal_fixpeaks,ecg_peaks,signal_rate,ecg_process,ecg_plotExamples
Step 1. Delineate
In [1]: import neurokit2 as nk

# Simulate ECG signal
In [2]: ecg = nk.ecg_simulate(duration=10, sampling_rate=1000)

# Get R-peaks location
In [3]: _, rpeaks = nk.ecg_peaks(ecg, sampling_rate=1000)

# Delineate cardiac cycle
In [4]: signals, waves = nk.ecg_delineate(ecg, rpeaks, sampling_rate=1000)
Step 2. Plot P-Peaks and T-Peaks
In [5]: nk.events_plot([waves["ECG_P_Peaks"], waves["ECG_T_Peaks"]], ecg)
Out[5]: <Figure size 640x480 with 1 Axes>
References
Martínez, J. P., Almeida, R., Olmos, S., Rocha, A. P., & Laguna, P. (2004). A wavelet-based ECG delineator: evaluation on standard databases. IEEE Transactions on biomedical engineering, 51(4), 570-581.
Emrich, J., Gargano, A., Koka, T., & Muma, M. (2024). Physiology-Informed ECG Delineation Based on Peak Prominence. 32nd European Signal Processing Conference (EUSIPCO), 1402-1406.
ecg_phase()#
- ecg_phase(ecg_cleaned, rpeaks=None, delineate_info=None, sampling_rate=None)[source]#
Find the Cardiac Phase
Compute cardiac phase (for both atrial and ventricular), labelled as 1 for systole and 0 for diastole.
- Parameters:
ecg_cleaned (Union[list, np.array, pd.Series]) – The cleaned ECG channel as returned by
ecg_clean().rpeaks (list or array or DataFrame or Series or dict) – The samples at which the different ECG peaks occur. If a dict or a DataFrame is passed, it is assumed that these containers were obtained with
ecg_findpeaks()orecg_peaks().delineate_info (dict) – A dictionary containing additional information of ecg delineation and can be obtained with
ecg_delineate().sampling_rate (int) – The sampling frequency of
ecg_signal(in Hz, i.e., samples/second). Defaults toNone.
- Returns:
signals (DataFrame) – A DataFrame of same length as
ecg_signalcontaining the following columns:"ECG_Phase_Atrial": cardiac phase, marked by “1” for systole and “0” for diastole."ECG_Phase_Completion_Atrial": cardiac phase (atrial) completion, expressed in percentage (from 0 to 1), representing the stage of the current cardiac phase."ECG_Phase_Ventricular": cardiac phase, marked by “1” for systole and “0” for diastole."ECG_Phase_Completion_Ventricular": cardiac phase (ventricular) completion, expressed in percentage (from 0 to 1), representing the stage of the current cardiac phase.
See also
Examples
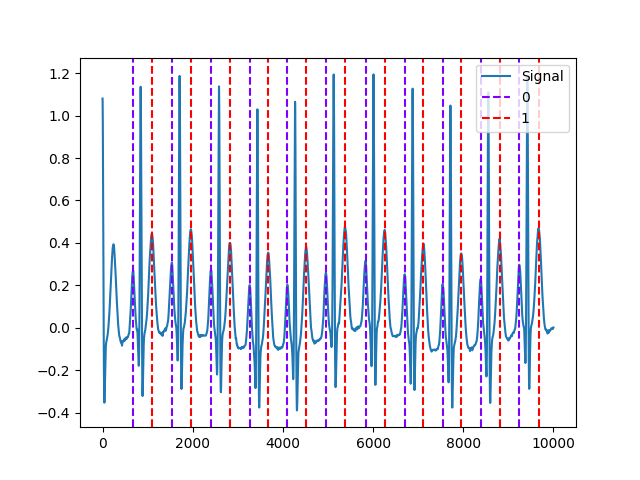
In [1]: import neurokit2 as nk

In [2]: ecg = nk.ecg_simulate(duration=6, sampling_rate=1000)

In [3]: _, rpeaks = nk.ecg_peaks(ecg)

In [4]: signals, waves = nk.ecg_delineate(ecg, rpeaks, sampling_rate=1000)

In [5]: cardiac_phase = nk.ecg_phase(ecg_cleaned=ecg, rpeaks=rpeaks,
   ...:                              delineate_info=waves, sampling_rate=1000)
   ...:

In [6]: _, ax = plt.subplots(nrows=2)

In [7]: ax[0].plot(nk.rescale(ecg), label="ECG", color="red", alpha=0.3)
Out[7]: [<matplotlib.lines.Line2D at 0x7fa8b06a4190>]

In [8]: ax[0].plot(cardiac_phase["ECG_Phase_Atrial"], label="Atrial Phase", color="orange")
Out[8]: [<matplotlib.lines.Line2D at 0x7fa8b06a42d0>]

In [9]: ax[0].plot(cardiac_phase["ECG_Phase_Completion_Atrial"],
   ...:            label="Atrial Phase Completion", linestyle="dotted")
   ...:
Out[9]: [<matplotlib.lines.Line2D at 0x7fa8b06a4410>]

In [10]: ax[0].legend(loc="upper right")
Out[10]: <matplotlib.legend.Legend at 0x7fa8b06a4550>

In [11]: ax[1].plot(nk.rescale(ecg), label="ECG", color="red", alpha=0.3)
Out[11]: [<matplotlib.lines.Line2D at 0x7fa8b06a60d0>]

In [12]: ax[1].plot(cardiac_phase["ECG_Phase_Ventricular"], label="Ventricular Phase", color="green")
Out[12]: [<matplotlib.lines.Line2D at 0x7fa8b06a6350>]

In [13]: ax[1].plot(cardiac_phase["ECG_Phase_Completion_Ventricular"],
   ....:            label="Ventricular Phase Completion", linestyle="dotted")
   ....:
Out[13]: [<matplotlib.lines.Line2D at 0x7fa8b06a6490>]

In [14]: ax[1].legend(loc="upper right")
Out[14]: <matplotlib.legend.Legend at 0x7fa8b06a6210>
ecg_rate()#
- ecg_rate(peaks, sampling_rate=1000, desired_length=(), interpolation_method='monotone_cubic', show=False)#
Compute Signal Rate
Calculate signal rate (per minute) from a series of peaks. It is a general function that works for any series of peaks (i.e., not specific to a particular type of signal). It is computed as
60 / period, where the period is the time between the peaks (see func:.signal_period).Note
This function is implemented under
signal_rate(), but it also re-exported under different names, such asecg_rate(), orrsp_rate(). The aliases are provided for consistency.- Parameters:
peaks (Union[list, np.array, pd.DataFrame, pd.Series, dict]) – The samples at which the peaks occur. If an array is passed in, it is assumed that it was obtained with
signal_findpeaks(). If a DataFrame is passed in, it is assumed it is of the same length as the input signal in which occurrences of R-peaks are marked as “1”, with such containers obtained with e.g., :func:.`ecg_findpeaks` orrsp_findpeaks().sampling_rate (int) – The sampling frequency of the signal that contains peaks (in Hz, i.e., samples/second). Defaults to 1000.
desired_length (int) – If left at the default None, the returned rated will have the same number of elements as
peaks. If set to a value larger than the sample at which the last peak occurs in the signal (i.e.,peaks[-1]), the returned rate will be interpolated between peaks overdesired_lengthsamples. To interpolate the rate over the entire duration of the signal, setdesired_lengthto the number of samples in the signal. Cannot be smaller than or equal to the sample at which the last peak occurs in the signal. Defaults toNone.- interpolation_method (str) – Method used to interpolate the rate between peaks. See
signal_interpolate(). "monotone_cubic"is chosen as the default interpolation method since it ensures monotone interpolation between data points (i.e., it prevents physiologically implausible “overshoots” or “undershoots” in the y-direction). In contrast, the widely used cubic spline interpolation does not ensure monotonicity.- showbool
If
True, shows a plot. Defaults toFalse.
- interpolation_method (str) – Method used to interpolate the rate between peaks. See
- Returns:
array – A vector containing the rate (peaks per minute).
See also
signal_period,signal_findpeaks,signal_fixpeaks,signal_plotExamples
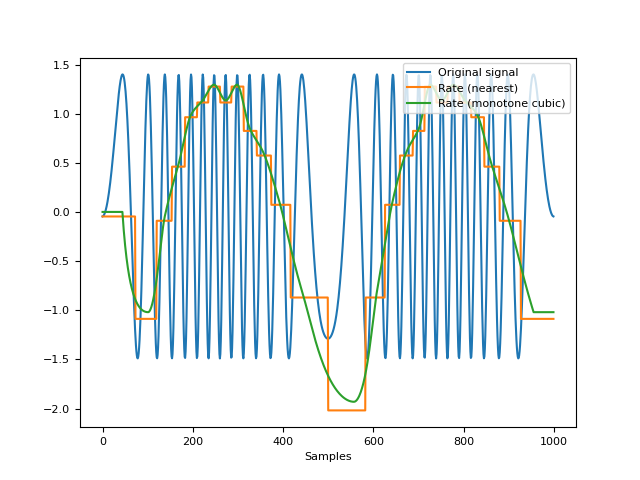
In [1]: import neurokit2 as nk

# Create signal of varying frequency
In [2]: freq = nk.signal_simulate(1, frequency = 1)

In [3]: signal = np.sin((freq).cumsum() * 0.5)

# Find peaks
In [4]: info = nk.signal_findpeaks(signal)

# Compute rate using 2 methods
In [5]: rate1 = nk.signal_rate(peaks=info["Peaks"],
   ...:                        desired_length=len(signal),
   ...:                        interpolation_method="nearest")
   ...:

In [6]: rate2 = nk.signal_rate(peaks=info["Peaks"],
   ...:                        desired_length=len(signal),
   ...:                        interpolation_method="monotone_cubic")
   ...:

# Visualize signal and rate on the same scale
In [7]: nk.signal_plot([signal, rate1, rate2],
   ...:                labels = ["Original signal", "Rate (nearest)", "Rate (monotone cubic)"],
   ...:                standardize = True)
   ...:
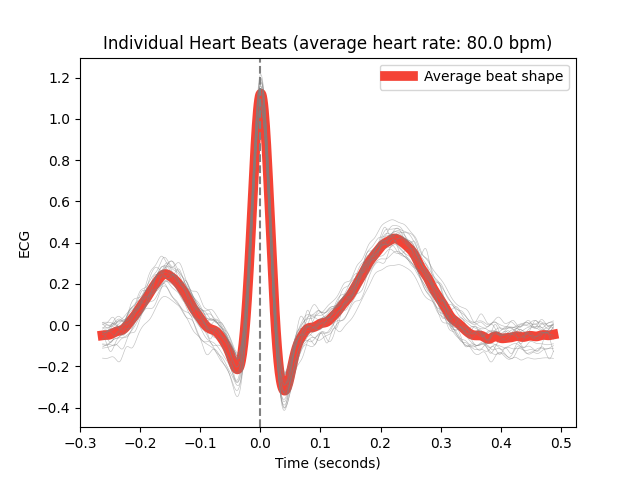
ecg_segment()#
- ecg_segment(ecg_cleaned, rpeaks=None, sampling_rate=1000, show=False, **kwargs)[source]#
Segment an ECG signal into single heartbeats
Segment an ECG signal into single heartbeats. Convenient for visualizing all the heart beats.
- Parameters:
ecg_cleaned (Union[list, np.array, pd.Series]) – The cleaned ECG channel as returned by
ecg_clean().rpeaks (dict) – The samples at which the R-peaks occur. Dict returned by
ecg_peaks(). Defaults toNone.sampling_rate (int) – The sampling frequency of
ecg_cleaned(in Hz, i.e., samples/second). Defaults to 1000.show (bool) – If
True, will return a plot of heartbeats. Defaults toFalse. If “return”, returns the axis of the plot.**kwargs – Other arguments to be passed.
- Returns:
dict – A dict containing DataFrames for all segmented heartbeats.
Examples
In [1]: import neurokit2 as nk

In [2]: ecg = nk.ecg_simulate(duration=15, sampling_rate=1000, heart_rate=80, noise = 0.05)

In [3]: qrs_epochs = nk.ecg_segment(ecg, rpeaks=None, sampling_rate=1000, show=True)
Analysis#
Miscellaneous#
ecg_findpeaks()#
- ecg_findpeaks(ecg_cleaned, sampling_rate=1000, method='neurokit', show=False, **kwargs)[source]#
Locate R-peaks
Low-level function used by
ecg_peaks()to identify R-peaks in an ECG signal using a different set of algorithms. Use the main function and see its documentation for details.- Parameters:
ecg_cleaned (Union[list, np.array, pd.Series]) – See
ecg_peaks().sampling_rate (int) – See
ecg_peaks().method (string) – See
ecg_peaks().show (bool) – If
True, will return a plot to visualizing the thresholds used in the algorithm. Useful for debugging.**kwargs – Additional keyword arguments, usually specific for each
method.
- Returns:
info (dict) – A dictionary containing additional information, in this case the samples at which R-peaks occur, accessible with the key
"ECG_R_Peaks".
See also
ecg_invert()#
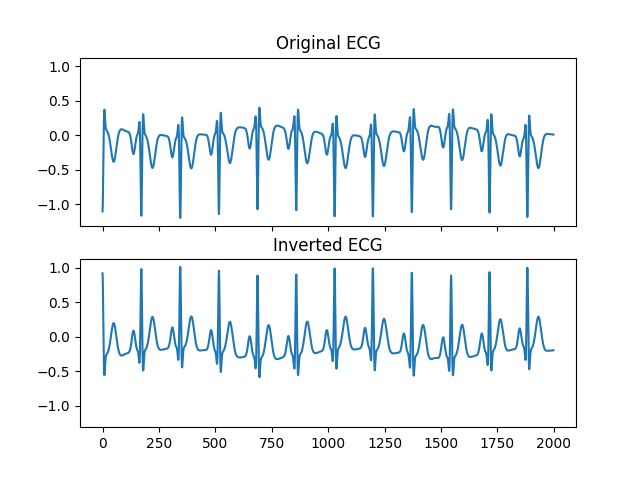
- ecg_invert(ecg_signal, sampling_rate=1000, force=False, show=False)[source]#
ECG signal inversion
Checks whether an ECG signal is inverted, and if so, corrects for this inversion. To automatically detect the inversion, the ECG signal is cleaned, the mean is subtracted, and with a rolling window of 2 seconds, the original value corresponding to the maximum of the squared signal is taken. If the median of these values is negative, it is assumed that the signal is inverted.
- Parameters:
ecg_signal (Union[list, np.array, pd.Series]) – The raw ECG channel.
sampling_rate (int) – The sampling frequency of
ecg_signal(in Hz, i.e., samples/second). Defaults to 1000.force (bool) – Whether to force inversion of the signal regardless of whether it is detected as inverted. The default is False.
show (bool) – Shows a plot of the original and inverted signal.
- Returns:
array – Vector containing the corrected ECG signal.
bool – Whether the inversion was performed.
Examples
In [1]: import neurokit2 as nk

In [2]: ecg = -1 * nk.ecg_simulate(duration=10, sampling_rate=200, heart_rate=70)

# Invert if necessary
In [3]: ecg_fixed, is_inverted = nk.ecg_invert(ecg, sampling_rate=200, show=True)
Any function appearing below this point is not explicitly part of the documentation and should be added. Please open an issue if there is one.
Submodule for NeuroKit.