
Bio-related Functions#
Main#
bio_process()#
- bio_process(ecg=None, rsp=None, eda=None, emg=None, ppg=None, eog=None, keep=None, sampling_rate=1000)[source]#
Automated processing of bio signals
Wrapper for other bio processing functions of electrocardiography signals (ECG), respiration signals (RSP), electrodermal activity (EDA) and electromyography signals (EMG).
- Parameters:
data (DataFrame) – The DataFrame containing all the respective signals (e.g., ecg, rsp, Photosensor etc.). If provided, there is no need to fill in the other arguments denoting the channel inputs. Defaults to
None.ecg (Union[list, np.array, pd.Series]) – The raw ECG channel.
rsp (Union[list, np.array, pd.Series]) – The raw RSP channel (as measured, for instance, by a respiration belt).
eda (Union[list, np.array, pd.Series]) – The raw EDA channel.
emg (Union[list, np.array, pd.Series]) – The raw EMG channel.
ppg (Union[list, np.array, pd.Series]) – The raw PPG channel.
eog (Union[list, np.array, pd.Series]) – The raw EOG channel, extracted from
mne_channel_extract().()keep (DataFrame) – Dataframe or channels to add by concatenation to the processed dataframe (for instance, the Photosensor channel).
sampling_rate (int) – The sampling frequency of the signals (in Hz, i.e., samples/second). Defaults to
1000.
- Returns:
bio_df (DataFrame) – DataFrames of the following processed bio features:
”ECG”: the raw signal, the cleaned signal, the heart rate, and the R peaks indexes. Also generated by
ecg_process().”RSP”: the raw signal, the cleaned signal, the rate, and the amplitude. Also generated by
rsp_process().”EDA”: the raw signal, the cleaned signal, the tonic component, the phasic component, indexes of the SCR onsets, peaks, amplitudes, and half-recovery times. Also generated by
eda_process().”EMG”: the raw signal, the cleaned signal, and amplitudes. Also generated by
emg_process().”PPG”: the raw signal, the cleaned signal, rate and peaks. Also generated by
ppg_process().”RSA”: Respiratory Sinus Arrhythmia features generated by
ecg_rsa(), if both ECG and RSP are provided.”EOG”: the raw signal, the cleaned signal, the indexes of EOG blinks, and the blink rate.
bio_info (dict) – A dictionary containing the samples of peaks, troughs, amplitudes, onsets, offsets, periods of activation, recovery times of the respective processed signals, as well as the signals’ sampling rate.
See also
ecg_process,rsp_process,eda_process,emg_process,ppg_process,eog_processExample
Example 1: Using synthetic data
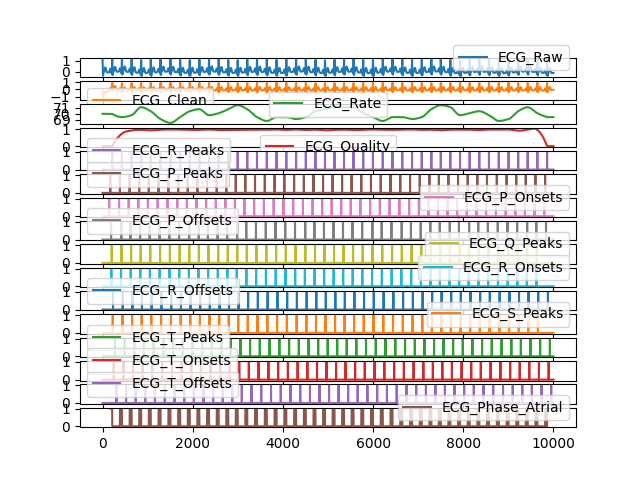
In [1]: import neurokit2 as nk

# With Simulated Data
In [2]: ecg = nk.ecg_simulate(duration=40, sampling_rate=250)

In [3]: rsp = nk.rsp_simulate(duration=40, sampling_rate=250)

In [4]: eda = nk.eda_simulate(duration=40, sampling_rate=250, scr_number=3)

In [5]: emg = nk.emg_simulate(duration=40, sampling_rate=250, burst_number=5)

In [6]: bio_df, bio_info = nk.bio_process(ecg=ecg, rsp=rsp, eda=eda, emg=emg, sampling_rate=250)

In [7]: bio_df.head()
Out[7]:
    ECG_Raw  ECG_Clean   ECG_Rate  ...  EMG_Offsets  RSA_P2T  RSA_Gates
0  1.055767  -0.070807  69.998963  ...            0      8.0   7.891479
1  1.005120  -0.189659  69.998963  ...            0      8.0   7.891479
2  0.873661  -0.321197  69.998963  ...            0      8.0   7.891479
3  0.686065  -0.470046  69.998963  ...            0      8.0   7.891479
4  0.468717  -0.633463  69.998963  ...            0      8.0   7.891479

[5 rows x 49 columns]
# Visualize a subset of signals
In [8]: bio_df.iloc[:, 0:16].plot(subplots=True)
Out[8]:
array([<Axes: >, <Axes: >, <Axes: >, <Axes: >, <Axes: >, <Axes: >,
       <Axes: >, <Axes: >, <Axes: >, <Axes: >, <Axes: >, <Axes: >,
       <Axes: >, <Axes: >, <Axes: >, <Axes: >], dtype=object)
Example 2: Using a real dataset
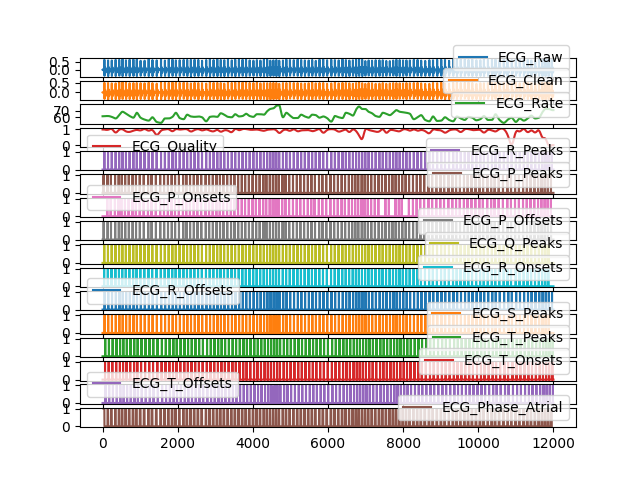
# Download EOG signal separately
In [9]: eog = nk.data('eog_100hz')

# Download data but crop with same length as eog signal
In [10]: data = nk.data('bio_eventrelated_100hz')[:len(eog)]

In [11]: bio_df, bio_info = nk.bio_process(ecg=data['ECG'], rsp=data['RSP'], eda=data['EDA'],
   ....: emg=None, eog=eog, keep=data['Photosensor'], sampling_rate=100)
   ....:

# Visualize all signals
In [12]: bio_df.iloc[:, 0:16].plot(subplots=True)
Out[12]:
array([<Axes: >, <Axes: >, <Axes: >, <Axes: >, <Axes: >, <Axes: >,
       <Axes: >, <Axes: >, <Axes: >, <Axes: >, <Axes: >, <Axes: >,
       <Axes: >, <Axes: >, <Axes: >, <Axes: >], dtype=object)
bio_analyze()#
- bio_analyze(data, sampling_rate=1000, method='auto', window_lengths='constant')[source]#
Automated analysis of physiological signals
Wrapper for other bio analyze functions of electrocardiography signals (ECG), respiration signals (RSP), electrodermal activity (EDA), electromyography signals (EMG) and electrooculography signals (EOG).
- Parameters:
data (DataFrame) – The DataFrame containing all the processed signals, typically produced by
bio_process(),ecg_process(),rsp_process(),eda_process(),emg_process()oreog_process(). Can also be an epochs object.sampling_rate (int) – The sampling frequency of the signals (in Hz, i.e., samples/second). Defaults to 1000.
method (str) – Can be one of
"event-related"for event-related analysis on epochs, or"interval-related"for analysis on longer periods of data. Defaults toautowhere the right method will be chosen based on the mean duration of the data (event-related for duration under 10s).window_lengths (dict) – If
constant(default), will use the full epoch for all the signals. Can also be a dictionary with the epoch start and end times for different types of signals, e.g.,window_lengths = {"ECG": [0.5, 1.5], "EDA": [0.5, 3.5]}
- Returns:
DataFrame – DataFrame of the analyzed bio features. See docstrings of
ecg_analyze(),rsp_analyze(),eda_analyze(),emg_analyze()andeog_analyze()for more details. Also returns Respiratory Sinus Arrhythmia features produced byhrv_rsa()if interval-related analysis is carried out.
See also
ecg_analyze,rsp_analyze,eda_analyze,emg_analyze,eog_analyzeExamples
Example 1: Event-related analysis
In [1]: import neurokit2 as nk

# Download data
In [2]: data = nk.data("bio_eventrelated_100hz")

# Process the data
In [3]: df, info = nk.bio_process(ecg=data["ECG"], rsp=data["RSP"], eda=data["EDA"],
   ...:                           keep=data["Photosensor"], sampling_rate=100)
   ...:

# Build epochs around photosensor-marked events
In [4]: events = nk.events_find(data["Photosensor"], threshold_keep="below",
   ...:                         event_conditions=["Negative", "Neutral",
   ...:                                           "Neutral", "Negative"])
   ...:

In [5]: epochs = nk.epochs_create(df, events, sampling_rate=100, epochs_start=-0.1,
   ...:                           epochs_end=1.9)
   ...:

# Analyze
In [6]: nk.bio_analyze(epochs, sampling_rate=100)
Out[6]:
  Label Condition  Event_Onset  ...  SCR_RecoveryTime    RSA_P2T  RSA_Gates
1     1  Negative         1024  ...               NaN   7.111969   0.000000
2     2   Neutral         4957  ...               NaN -15.476818   0.012038
3     3   Neutral         9224  ...               NaN  -6.685871   0.027382
4     4  Negative        12984  ...               NaN  -0.397892  -0.005452

[4 rows x 46 columns]
Example 2: Interval-related analysis
# Download data
In [7]: data = nk.data("bio_resting_5min_100hz")

# Process the data
In [8]: df, info = nk.bio_process(ecg=data["ECG"], rsp=data["RSP"], ppg=data["PPG"], sampling_rate=100)

# Analyze
In [9]: nk.bio_analyze(df, sampling_rate=100)
Out[9]:
  ECG_Rate_Mean             HRV_MeanNN  ... RSA_Gates_Mean_log RSA_Gates_SD
0     86.392105  [[694.7563805104409]]  ...           2.045955     0.156187

[1 rows x 240 columns]