
EDA#
Main#
eda_process()#
- eda_process(eda_signal, sampling_rate=1000, method='neurokit', report=None, **kwargs)[source]#
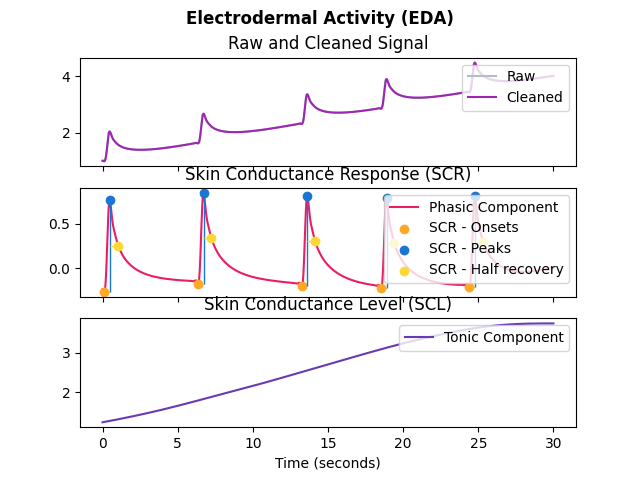
Process Electrodermal Activity (EDA)
Convenience function that automatically processes electrodermal activity (EDA) signal.
- Parameters:
eda_signal (Union[list, np.array, pd.Series]) – The raw EDA signal.
sampling_rate (int) – The sampling frequency of
"eda_signal"(in Hz, i.e., samples/second).method (str) – The processing pipeline to apply. Can be one of
"biosppy"or"neurokit"(default).report (str) – The filename of a report containing description and figures of processing (e.g.
"myreport.html"). Needs to be supplied if a report file should be generated. Defaults toNone. Can also be"text"to just print the text in the console without saving anything.**kwargs – Other arguments to be passed to specific methods. For more information, see
rsp_methods().
- Returns:
signals (DataFrame) – A DataFrame of same length as
"eda_signal"containing the following columns:EDA_Raw: The raw signal.EDA_Clean: The cleaned signal.EDA_Tonic: The tonic component of the signal, or the Tonic Skin Conductance Level (SCL).EDA_Phasic: The phasic component of the signal, or the Phasic Skin Conductance Response (SCR).SCR_Onsets: The samples at which the onsets of the peaks occur, marked as “1” in a list of zeros.SCR_Peaks: The samples at which the peaks occur, marked as “1” in a list of zeros.SCR_Height: The SCR amplitude of the signal including the Tonic component. Note that cumulative effects of close-occurring SCRs might lead to an underestimation of the amplitude.SCR_Amplitude: The SCR amplitude of the signal excluding the Tonic component.SCR_RiseTime: The time taken for SCR onset to reach peak amplitude within the SCR.SCR_Recovery: The samples at which SCR peaks recover (decline) to half amplitude, marked as “1” in a list of zeros.
info (dict) – A dictionary containing the information of each SCR peak (see
eda_findpeaks()), as well as the signals’ sampling rate.
See also
eda_simulate,eda_clean,eda_phasic,eda_findpeaks,eda_plotExamples
In [1]: import neurokit2 as nk

In [2]: eda_signal = nk.eda_simulate(duration=30, scr_number=5, drift=0.1, noise=0)

In [3]: signals, info = nk.eda_process(eda_signal, sampling_rate=1000)

In [4]: nk.eda_plot(signals, info)
eda_analyze()#
- eda_analyze(data, sampling_rate=1000, method='auto')[source]#
EDA Analysis
Perform EDA analysis on either epochs (event-related analysis) or on longer periods of data such as resting-state data.
- Parameters:
data (Union[dict, pd.DataFrame]) – A dictionary of epochs, containing one DataFrame per epoch, usually obtained via epochs_create, or a DataFrame containing all epochs, usually obtained via epochs_to_df. Can also take a DataFrame of processed signals from a longer period of data, typically generated by eda_process or bio_process. Can also take a dict containing sets of separate periods of data.
sampling_rate (int) – The sampling frequency of the signal (in Hz, i.e., samples/second). Defaults to 1000Hz.
method (str) – Can be one of
"event-related"for event-related analysis on epochs, or"interval-related"for analysis on longer periods of data. Defaults to"auto"where the right method will be chosen based on the mean duration of the data ("event-related"for duration under 10s).
- Returns:
DataFrame – A dataframe containing the analyzed EDA features. If event-related analysis is conducted, each epoch is indicated by the Label column. See
eda_eventrelated()andeda_intervalrelated()docstrings for details.
Examples
Example 1: Data for event-related analysis
In [1]: import neurokit2 as nk

# Download the data for event-related analysis
In [2]: data = nk.data("bio_eventrelated_100hz")

# Process the data for event-related analysis
In [3]: df, info = nk.bio_process(eda=data["EDA"], sampling_rate=100)

In [4]: events = nk.events_find(data["Photosensor"], threshold_keep='below',
   ...:                         event_conditions=["Negative", "Neutral", "Neutral", "Negative"])
   ...:

In [5]: epochs = nk.epochs_create(df, events, sampling_rate=100, epochs_start=-0.1, epochs_end=1.9)

# Analyze
In [6]: analyze_epochs = nk.eda_analyze(epochs, sampling_rate=100)

In [7]: analyze_epochs
Out[7]:
  Label Condition  ...  SCR_RiseTime  SCR_RecoveryTime
1     1  Negative  ...           NaN               NaN
2     2   Neutral  ...           NaN               NaN
3     3   Neutral  ...           NaN               NaN
4     4  Negative  ...           NaN               NaN

[4 rows x 9 columns]
Example 2: Resting-state data
In [8]: import neurokit2 as nk

# Download the resting-state data
In [9]: data = nk.data("bio_resting_8min_100hz")

# Process the data
In [10]: df, info = nk.eda_process(data["EDA"], sampling_rate=100)

# Analyze
In [11]: analyze_df = nk.eda_analyze(df, sampling_rate=100)

In [12]: analyze_df
Out[12]:
   SCR_Peaks_N  SCR_Peaks_Amplitude_Mean  ...  EDA_SympatheticN  EDA_Autocorrelation
0          2.0                  1.872206  ...          0.000037             0.974848

[1 rows x 6 columns]
eda_plot()#
- eda_plot(eda_signals, info=None, static=True)[source]#
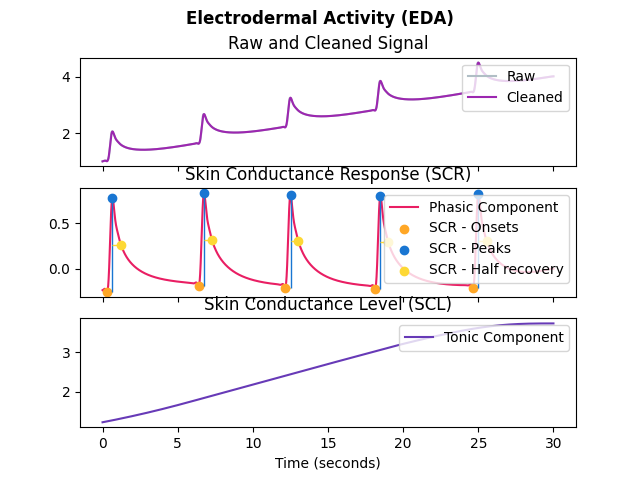
Visualize electrodermal activity (EDA) data
- Parameters:
eda_signals (DataFrame) – DataFrame obtained from
eda_process().info (dict) – The information Dict returned by
eda_process(). Defaults toNone.static (bool) – If True, a static plot will be generated with matplotlib. If False, an interactive plot will be generated with plotly. Defaults to True.
- Returns:
See
ecg_plot()for details on how to access the figure, modify the size and save it.
Examples
In [1]: import neurokit2 as nk

In [2]: eda_signal = nk.eda_simulate(duration=30, scr_number=5, drift=0.1, noise=0, sampling_rate=250)

In [3]: eda_signals, info = nk.eda_process(eda_signal, sampling_rate=250)

In [4]: nk.eda_plot(eda_signals, info)
See also
eda_simulate()#
- eda_simulate(duration=10, length=None, sampling_rate=1000, noise=0.01, scr_number=1, drift=-0.01, random_state=None, random_state_distort='spawn')[source]#
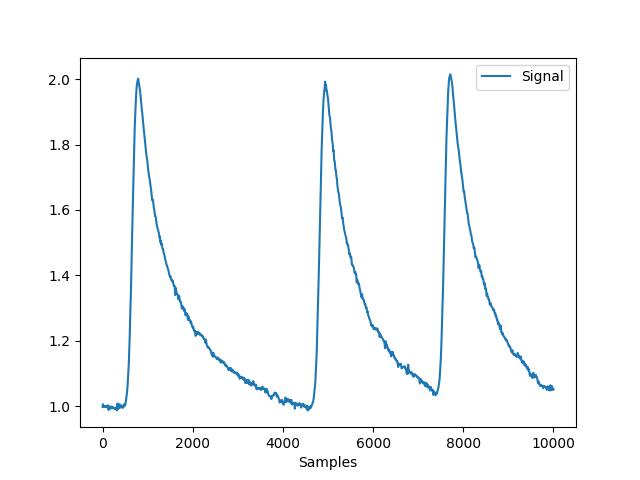
Simulate Electrodermal Activity (EDA) signal
Generate an artificial (synthetic) EDA signal of a given duration and sampling rate.
- Parameters:
duration (int) – Desired recording length in seconds.
sampling_rate (int) – The desired sampling rate (in Hz, i.e., samples/second). Defaults to 1000Hz.
length (int) – The desired length of the signal (in samples). Defaults to None.
noise (float) – Noise level (amplitude of the laplace noise). Defaults to 0.01.
scr_number (int) – Desired number of skin conductance responses (SCRs), i.e., peaks. Defaults to 1.
drift (float or list) – The slope of a linear drift of the signal. Defaults to -0.01.
random_state (None, int, numpy.random.RandomState or numpy.random.Generator) – Seed for the random number generator. See for
misc.check_random_statefor further information.random_state_distort ({‘legacy’, ‘spawn’}, None, int, numpy.random.RandomState or numpy.random.Generator) – Random state to be used to distort the signal. If
"legacy", use the same random state used to generate the signal (discouraged as it creates dependent random streams). If"spawn", spawn independent children random number generators from the random_state argument. If any of the other types, generate independent children random number generators from the random_state_distort provided (this allows generating multiple version of the same signal distorted by different random noise realizations).
- Returns:
array – Vector containing the EDA signal.
Examples
In [1]: import neurokit2 as nk

In [2]: import pandas as pd

In [3]: eda = nk.eda_simulate(duration=10, scr_number=3)

In [4]: fig = nk.signal_plot(eda)
See also
ecg_simulate,rsp_simulate,emg_simulate,ppg_simulateReferences
Bach, D. R., Flandin, G., Friston, K. J., & Dolan, R. J. (2010). Modelling event-related skin conductance responses. International Journal of Psychophysiology, 75(3), 349-356.
Preprocessing#
eda_clean()#
- eda_clean(eda_signal, sampling_rate=1000, method='neurokit')[source]#
Preprocess Electrodermal Activity (EDA) signal
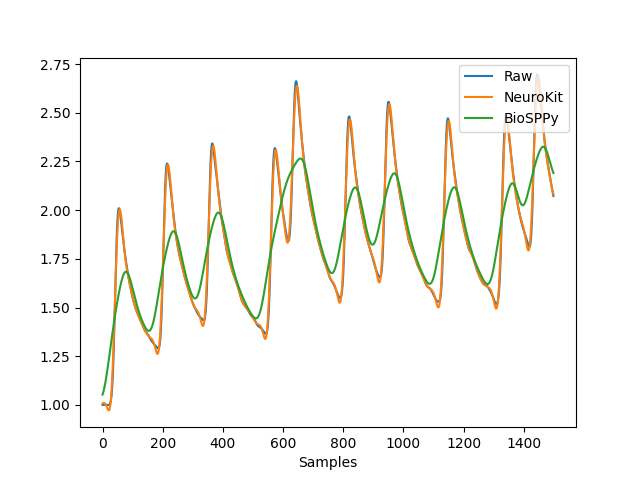
This function cleans the EDA signal by removing noise and smoothing the signal with different methods.
NeuroKit: Default methods. Low-pass filter with a 3 Hz cutoff frequency and a 4th order Butterworth filter. Note thaht if the sampling rate is lower than 7 Hz (as it is the case with some signals recorded by wearables such as Empatica), the filtering is skipped (as there is no high enough frequency to remove).
BioSPPy: More aggresive filtering than NeuroKit’s default method. Low-pass filter with a 5 Hz cutoff frequency and a 4th order Butterworth filter.
- Parameters:
eda_signal (Union[list, np.array, pd.Series]) – The raw EDA signal.
sampling_rate (int) – The sampling frequency of rsp_signal (in Hz, i.e., samples/second).
method (str) – The processing pipeline to apply. Can be one of
"neurokit"(default),"biosppy", or"none".
- Returns:
array – Vector containing the cleaned EDA signal.
See also
Examples
In [1]: import pandas as pd

In [2]: import neurokit2 as nk

# Simulate raw signal
In [3]: eda = nk.eda_simulate(duration=15, sampling_rate=100, scr_number=10, noise=0.01, drift=0.02)

# Clean
In [4]: eda_clean1 = nk.eda_clean(eda, sampling_rate=100, method='neurokit')

In [5]: eda_clean2 = nk.eda_clean(eda, sampling_rate=100, method='biosppy')

In [6]: nk.signal_plot([eda, eda_clean1, eda_clean2], labels=["Raw", "NeuroKit", "BioSPPy"])
eda_phasic()#
- eda_phasic(eda_signal, sampling_rate=1000, method='highpass', **kwargs)[source]#
Electrodermal Activity (EDA) Decomposition into Phasic and Tonic Components
Decompose the Electrodermal Activity (EDA) into two components, namely Phasic and Tonic, using different methods including cvxEDA (Greco, 2016) or Biopac’s Acqknowledge algorithms.
High-pass filtering: Method implemented in Biopac’s Acqknowledge. The raw EDA signal is passed through a high pass filter with a cutoff frequency of 0.05 Hz (cutoff frequency can be adjusted by the
cutoffargument).Median smoothing: Method implemented in Biopac’s Acqknowledge. The raw EDA signal is passed through a median value smoothing filter, which removes areas of rapid change. The phasic component is then calculated by subtracting the smoothed signal from the original. This method is computationally intensive and the processing time depends on the smoothing factor, which can be controlled by the as
smoothing_factorargument, set by default to4seconds. Higher values will produce results more rapidly.cvxEDA: Convex optimization approach to EDA processing (Greco, 2016). Requires the
cvxoptpackage (> 1.3.0.1) to be installed.SparsEDA: Sparse non-negative deconvolution (Hernando-Gallego et al., 2017).
Warning
sparsEDA was newly added thanks to this implementation. Help is needed to double-check it, improve it and make it more concise and efficient. Also, sometimes it errors for unclear reasons. Please help.
- Parameters:
eda_signal (Union[list, np.array, pd.Series]) – The raw EDA signal.
sampling_rate (int) – The sampling frequency of raw EDA signal (in Hz, i.e., samples/second). Defaults to 1000Hz.
method (str) – The processing pipeline to apply. Can be one of
"cvxEDA","smoothmedian","highpass". Defaults to"highpass".**kwargs (dict) – Additional arguments to pass to the specific method.
- Returns:
DataFrame – DataFrame containing the
"Tonic"and the"Phasic"components as columns.
See also
Examples
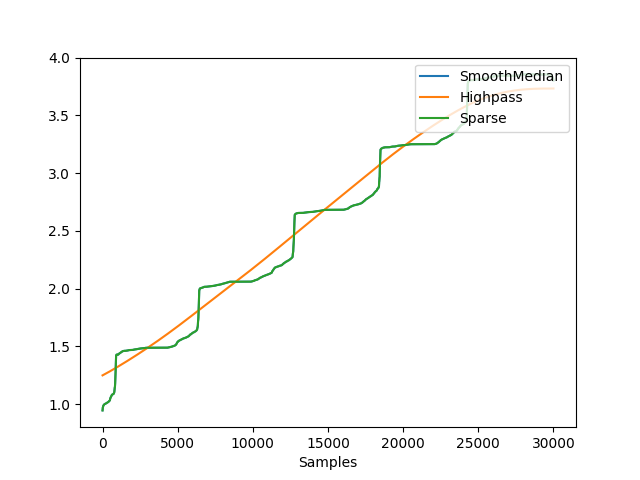
Example 1: Methods comparison.
In [1]: import neurokit2 as nk

# Simulate EDA signal
In [2]: eda_signal = nk.eda_simulate(duration=30, scr_number=5, drift=0.1)

# Decompose using different algorithms
# cvxEDA = nk.eda_phasic(eda_signal, method='cvxeda')
In [3]: smoothMedian = nk.eda_phasic(eda_signal, method='smoothmedian')

In [4]: highpass = nk.eda_phasic(eda_signal, method='highpass')

In [5]: sparse = nk.eda_phasic(eda_signal, method='smoothmedian')

# Extract tonic and phasic components for plotting
In [6]: t1, p1 = smoothMedian["EDA_Tonic"].values, smoothMedian["EDA_Phasic"].values

In [7]: t2, p2 = highpass["EDA_Tonic"].values, highpass["EDA_Phasic"].values

In [8]: t3, p3 = sparse["EDA_Tonic"].values, sparse["EDA_Phasic"].values

# Plot tonic
In [9]: nk.signal_plot([t1, t2, t3], labels=["SmoothMedian", "Highpass", "Sparse"])

# Plot phasic
In [10]: nk.signal_plot([p1, p2, p3], labels=["SmoothMedian", "Highpass", "Sparse"])
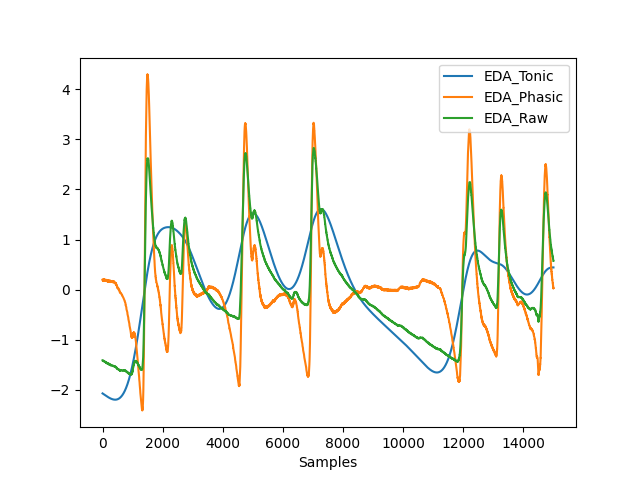
Example 2: Real data.
In [11]: eda_signal = nk.data("bio_eventrelated_100hz")["EDA"]

In [12]: data = nk.eda_phasic(nk.standardize(eda_signal), sampling_rate=100)

In [13]: data["EDA_Raw"] = eda_signal

In [14]: nk.signal_plot(data, standardize=True)
References
Greco, A., Valenza, G., & Scilingo, E. P. (2016). Evaluation of CDA and CvxEDA Models. In Advances in Electrodermal Activity Processing with Applications for Mental Health (pp. 35-43). Springer International Publishing.
Greco, A., Valenza, G., Lanata, A., Scilingo, E. P., & Citi, L. (2016). cvxEDA: A convex optimization approach to electrodermal activity processing. IEEE Transactions on Biomedical Engineering, 63(4), 797-804.
Hernando-Gallego, F., Luengo, D., & Artés-Rodríguez, A. (2017). Feature extraction of galvanic skin responses by nonnegative sparse deconvolution. IEEE journal of biomedical and shealth informatics, 22(5), 1385-1394.
eda_peaks()#
- eda_peaks(eda_phasic, sampling_rate=1000, method='neurokit', amplitude_min=0.1)[source]#
Find Skin Conductance Responses (SCR) in Electrodermal Activity (EDA)
Identify Skin Conductance Responses (SCR) peaks in the phasic component of Electrodermal Activity (EDA) with different possible methods, such as:
- Parameters:
eda_phasic (Union[list, np.array, pd.Series]) – The phasic component of the EDA signal (from
eda_phasic()).sampling_rate (int) – The sampling frequency of the EDA signal (in Hz, i.e., samples/second).
method (str) – The processing pipeline to apply. Can be one of
"neurokit"(default),"gamboa2008","kim2004"(the default in BioSPPy),"vanhalem2020"or"nabian2018".amplitude_min (float) – Only used if
methodis"neurokit"or"kim2004". Minimum threshold by which to exclude SCRs (peaks) as relative to the largest amplitude in the signal.
- Returns:
info (dict) – A dictionary containing additional information, in this case the aplitude of the SCR, the samples at which the SCR onset and the SCR peaks occur. Accessible with the keys
"SCR_Amplitude","SCR_Onsets", and"SCR_Peaks"respectively. It also contains the signals’ sampling rate.signals (DataFrame) – A DataFrame of same length as the input signal in which occurences of SCR peaks are marked as “1” in lists of zeros with the same length as
"eda_cleaned". Accessible with the keys"SCR_Peaks".
See also
Examples
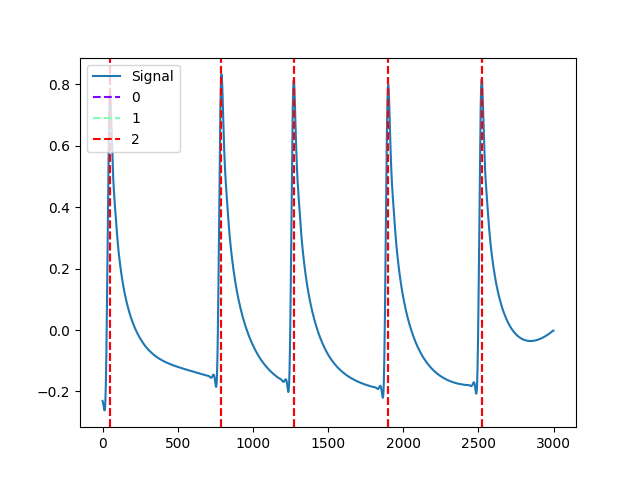
In [1]: import neurokit2 as nk

# Get phasic component
In [2]: eda_signal = nk.eda_simulate(duration=30, scr_number=5, drift=0.1, noise=0, sampling_rate=100)

In [3]: eda_cleaned = nk.eda_clean(eda_signal, sampling_rate=100)

In [4]: eda = nk.eda_phasic(eda_cleaned, sampling_rate=100)

In [5]: eda_phasic = eda["EDA_Phasic"].values

# Find peaks
In [6]: _, kim2004 = nk.eda_peaks(eda_phasic, sampling_rate=100, method="kim2004")

In [7]: _, neurokit = nk.eda_peaks(eda_phasic, sampling_rate=100, method="neurokit")

In [8]: _, nabian2018 = nk.eda_peaks(eda_phasic, sampling_rate=100, method="nabian2018")

In [9]: nk.events_plot([
   ...:     nabian2018["SCR_Peaks"],
   ...:     kim2004["SCR_Peaks"],
   ...:     neurokit["SCR_Peaks"]
   ...: ], eda_phasic)
   ...:
Out[9]: <Figure size 640x480 with 1 Axes>
References
Gamboa, H. (2008). Multi-modal behavioral biometrics based on hci and electrophysiology. PhD ThesisUniversidade.
Kim, K. H., Bang, S. W., & Kim, S. R. (2004). Emotion recognition system using short-term monitoring of physiological signals. Medical and biological engineering and computing, 42(3), 419-427.
van Halem, S., Van Roekel, E., Kroencke, L., Kuper, N., & Denissen, J. (2020). Moments That Matter? On the Complexity of Using Triggers Based on Skin Conductance to Sample Arousing Events Within an Experience Sampling Framework. European Journal of Personality.
Nabian, M., Yin, Y., Wormwood, J., Quigley, K. S., Barrett, L. F., & Ostadabbas, S. (2018). An Open-Source Feature Extraction Tool for the Analysis of Peripheral Physiological Data. IEEE journal of translational engineering in health and medicine, 6, 2800711.
eda_fixpeaks()#
- eda_fixpeaks(peaks, onsets=None, height=None)[source]#
Correct Skin Conductance Responses (SCR) peaks
Low-level function used by
"eda_peaks()"to correct the peaks found by"eda_findpeaks()". Doesn’t do anything for now for EDA. Seeeda_peaks()for details.- Parameters:
peaks (list or array or DataFrame or Series or dict) – The samples at which the SCR peaks occur. If a dict or a DataFrame is passed, it is assumed that these containers were obtained with
"eda_findpeaks()".onsets (list or array or DataFrame or Series or dict) – The samples at which the SCR onsets occur. If a dict or a DataFrame is passed, it is assumed that these containers were obtained with
"eda_findpeaks()". Defaults to None.height (list or array or DataFrame or Series or dict) – The samples at which the amplitude of the SCR peaks occur. If a dict or a DataFrame is passed, it is assumed that these containers were obtained with
"eda_findpeaks()". Defaults to None.
- Returns:
info (dict) – A dictionary containing additional information, in this case the aplitude of the SCR, the samples at which the SCR onset and the SCR peaks occur. Accessible with the keys
"SCR_Amplitude","SCR_Onsets", and"SCR_Peaks"respectively.
See also
eda_simulate,eda_clean,eda_phasic,eda_findpeaks,eda_peaks,eda_process,eda_plotExamples
In [1]: import neurokit2 as nk

# Get phasic component
In [2]: eda_signal = nk.eda_simulate(duration=30, scr_number=5, drift=0.1, noise=0)

In [3]: eda_cleaned = nk.eda_clean(eda_signal)

In [4]: eda = nk.eda_phasic(eda_cleaned)

In [5]: eda_phasic = eda["EDA_Phasic"].values

# Find and fix peaks
In [6]: info = nk.eda_findpeaks(eda_phasic)

In [7]: info = nk.eda_fixpeaks(info)

In [8]: nk.events_plot(info["SCR_Peaks"], eda_phasic)
Out[8]: <Figure size 640x480 with 1 Axes>
Analysis#
eda_sympathetic()#
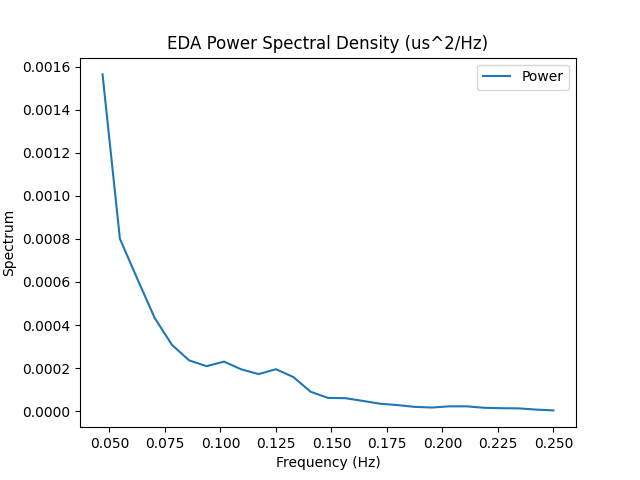
- eda_sympathetic(eda_signal, sampling_rate=1000, frequency_band=[0.045, 0.25], method='posada', show=False)[source]#
Sympathetic Nervous System Index from Electrodermal activity (EDA)
Derived from Posada-Quintero et al. (2016), who argue that dynamics of the sympathetic component of EDA signal is represented in the frequency band of 0.045-0.25Hz. Note that the Posada method requires a signal of a least 64 seconds.
- Parameters:
eda_signal (Union[list, np.array, pd.Series]) – The EDA signal (i.e., a time series) in the form of a vector of values.
sampling_rate (int) – The sampling frequency of the signal (in Hz, i.e., samples/second).
frequency_band (list) – List indicating the frequency range to compute the the power spectral density in. Defaults to [0.045, 0.25].
method (str) – Can be one of
"ghiasi"or"posada".show (bool) – If True, will return a plot of the power spectrum of the EDA signal within the specified frequency band.
See also
- Returns:
dict – A dictionary containing the EDA sympathetic indexes, accessible by keys
"EDA_Sympathetic"and"EDA_SympatheticN"(normalized, obtained by dividing EDA_Symp by total power).EDA_Sympathetic: Derived from Posada-Quintero et al. (2016), who argue that dynamics of the sympathetic component of EDA signal is represented in the frequency band of 0.045-0.25Hz.EDA_SympatheticN: normalized version of “EDA_Sympathetic” obtained by dividing EDA_Sympathetic by total power
Examples
In [1]: import neurokit2 as nk

In [2]: eda = nk.data('bio_resting_8min_100hz')['EDA']

In [3]: nk.eda_sympathetic(eda, sampling_rate=100, method='posada', show=True)
Out[3]:
{'EDA_Sympathetic': np.float64(0.0006638980045218816),
 'EDA_SympatheticN': np.float64(3.7368325327628205e-05)}

In [4]: results = nk.eda_sympathetic(eda, sampling_rate=100, method='ghiasi')

In [5]: results
Out[5]:
{'EDA_Sympathetic': np.float64(5.6544954350000156e-05),
 'EDA_SympatheticN': np.float64(0.001904476429570058)}
References
Ghiasi, S., Grecol, A., Nardelli, M., Catrambonel, V., Barbieri, R., Scilingo, E., & Valenza, G. (2018). A New Sympathovagal Balance Index from Electrodermal Activity and Instantaneous Vagal Dynamics: A Preliminary Cold Pressor Study. 2018 40th Annual International Conference of the IEEE Engineering in Medicine and Biology Society (EMBC). doi:10.1109/embc.2018.8512932
Posada-Quintero, H. F., Florian, J. P., Orjuela-Cañón, A. D., Aljama-Corrales, T., Charleston-Villalobos, S., & Chon, K. H. (2016). Power spectral density analysis of electrodermal activity for sympathetic function assessment. Annals of biomedical engineering, 44(10), 3124-3135.
eda_autocor()#
- eda_autocor(eda_cleaned, sampling_rate=1000, lag=4)[source]#
EDA Autocorrelation
Compute the autocorrelation measure of raw EDA signal i.e., the correlation between the time series data and a specified time-lagged version of itself.
- Parameters:
eda_cleaned (Union[list, np.array, pd.Series]) – The cleaned EDA signal.
sampling_rate (int) – The sampling frequency of raw EDA signal (in Hz, i.e., samples/second). Defaults to 1000Hz.
lag (int) – Time lag in seconds. Defaults to 4 seconds to avoid autoregressive correlations approaching 1, as recommended by Halem et al. (2020).
- Returns:
float – Autocorrelation index of the eda signal.
See also
Examples
In [1]: import neurokit2 as nk

# Simulate EDA signal
In [2]: eda_signal = nk.eda_simulate(duration=5, scr_number=5, drift=0.1)

In [3]: eda_cleaned = nk.eda_clean(eda_signal)

In [4]: cor = nk.eda_autocor(eda_cleaned)

In [5]: cor
Out[5]: np.float64(-0.23099923536609457)
References
van Halem, S., Van Roekel, E., Kroencke, L., Kuper, N., & Denissen, J. (2020). Moments that matter? On the complexity of using triggers based on skin conductance to sample arousing events within an experience sampling framework. European Journal of Personality, 34(5), 794-807.
eda_changepoints()#
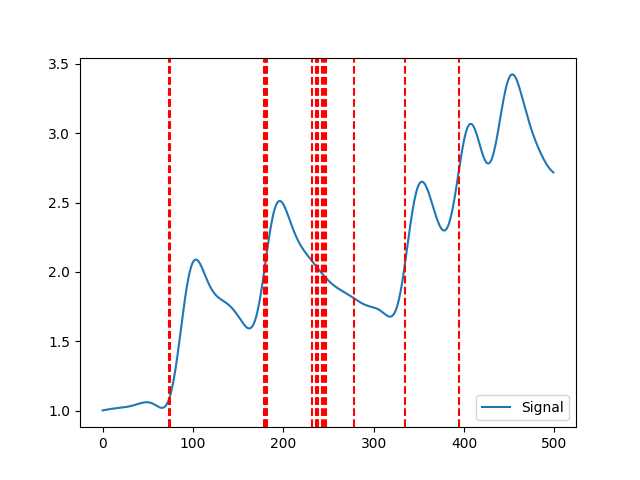
- eda_changepoints(eda_cleaned, penalty=10000, show=False)[source]#
Calculate Number of Change Points
Calculate the number of change points using of the skin conductance signal in terms of mean and variance.
Note
This function is somewhat experimental, and improvements or discussions about it are welcome.
- Parameters:
eda_cleaned (Union[list, np.array, pd.Series]) – The cleaned EDA signal.
penalty (int) – Defaults to an algorithm penalty of 10000, as recommended by Halem et al. (2020). See
signal_changepoints().show (bool) – Show the signal with the change points.
- Returns:
float – Number of changepoints in the
See also
Examples
In [1]: import neurokit2 as nk

# Simulate EDA signal
In [2]: eda_signal = nk.eda_simulate(duration=5, sampling_rate=100, scr_number=5, drift=0.1)

In [3]: eda_cleaned = nk.eda_clean(eda_signal, sampling_rate=100)

In [4]: nk.eda_changepoints(eda_cleaned, penalty = 100, show=True)
Out[4]: 15
References
van Halem, S., Van Roekel, E., Kroencke, L., Kuper, N., & Denissen, J. (2020). Moments that matter? On the complexity of using triggers based on skin conductance to sample arousing events within an experience sampling framework. European Journal of Personality, 34(5), 794-807.
Miscellaneous#
eda_findpeaks()#
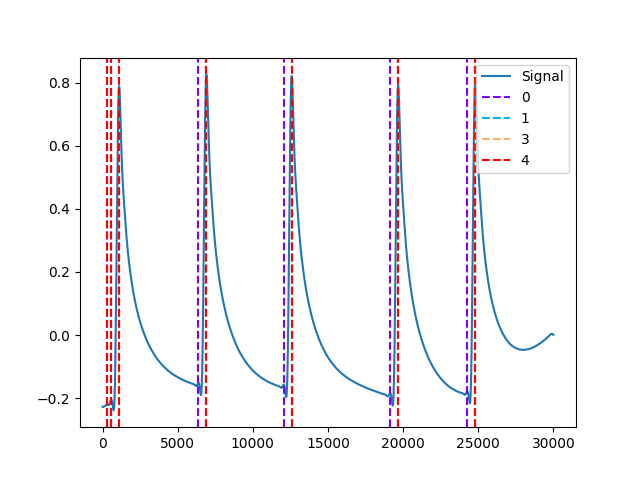
- eda_findpeaks(eda_phasic, sampling_rate=1000, method='neurokit', amplitude_min=0.1)[source]#
Find Skin Conductance Responses (SCR) in Electrodermal Activity (EDA)
Low-level function used by eda_peaks() to identify Skin Conductance Responses (SCR) peaks in the phasic component of Electrodermal Activity (EDA) with different possible methods. See
eda_peaks()for details.- Parameters:
eda_phasic (Union[list, np.array, pd.Series]) – The phasic component of the EDA signal (from
eda_phasic()).sampling_rate (int) – The sampling frequency of the EDA signal (in Hz, i.e., samples/second).
method (str) – The processing pipeline to apply. Can be one of
"neurokit"(default),"gamboa2008","kim2004"(the default in BioSPPy),"vanhalem2020"or"nabian2018".amplitude_min (float) – Only used if “method” is
"neurokit"or"kim2004". Minimum threshold by which to exclude SCRs (peaks) as relative to the largest amplitude in the signal.
- Returns:
info (dict) – A dictionary containing additional information, in this case the aplitude of the SCR, the samples at which the SCR onset and the SCR peaks occur. Accessible with the keys
"SCR_Amplitude","SCR_Onsets", and"SCR_Peaks"respectively.
See also
eda_simulate,eda_clean,eda_phasic,eda_fixpeaks,eda_peaks,eda_process,eda_plotExamples
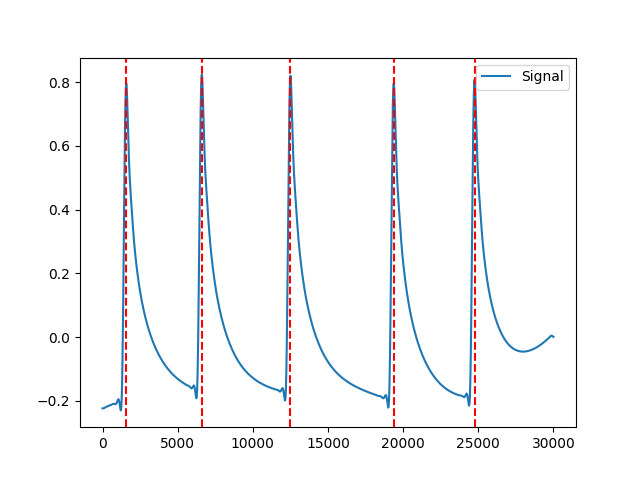
In [1]: import neurokit2 as nk

# Get phasic component
In [2]: eda_signal = nk.eda_simulate(duration=30, scr_number=5, drift=0.1, noise=0)

In [3]: eda_cleaned = nk.eda_clean(eda_signal)

In [4]: eda = nk.eda_phasic(eda_cleaned)

In [5]: eda_phasic = eda["EDA_Phasic"].values

# Find peaks
In [6]: gamboa2008 = nk.eda_findpeaks(eda_phasic, method="gamboa2008")

In [7]: kim2004 = nk.eda_findpeaks(eda_phasic, method="kim2004")

In [8]: neurokit = nk.eda_findpeaks(eda_phasic, method="neurokit")

In [9]: vanhalem2020 = nk.eda_findpeaks(eda_phasic, method="vanhalem2020")

In [10]: nabian2018 = nk.eda_findpeaks(eda_phasic, method="nabian2018")

In [11]: nk.events_plot([gamboa2008["SCR_Peaks"], kim2004["SCR_Peaks"], vanhalem2020["SCR_Peaks"],
   ....:                      neurokit["SCR_Peaks"], nabian2018["SCR_Peaks"]], eda_phasic)
   ....:
Out[11]: <Figure size 640x480 with 1 Axes>
References
Gamboa, H. (2008). Multi-modal behavioral biometrics based on hci and electrophysiology. PhD Thesis Universidade.
Kim, K. H., Bang, S. W., & Kim, S. R. (2004). Emotion recognition system using short-term monitoring of physiological signals. Medical and biological engineering and computing, 42(3), 419-427.
van Halem, S., Van Roekel, E., Kroencke, L., Kuper, N., & Denissen, J. (2020). Moments That Matter? On the Complexity of Using Triggers Based on Skin Conductance to Sample Arousing Events Within an Experience Sampling Framework. European Journal of Personality.
Nabian, M., Yin, Y., Wormwood, J., Quigley, K. S., Barrett, L. F., & Ostadabbas, S. (2018). An Open-Source Feature Extraction Tool for the Analysis of Peripheral Physiological Data. IEEE journal of translational engineering in health and medicine, 6, 2800711.
Any function appearing below this point is not explicitly part of the documentation and should be added. Please open an issue if there is one.
Submodule for NeuroKit.